

You are staring at a stock with a 7% dividend yield and cannot decide if it is a bargain or a value trap. That single decision could cost you thousands in missed gains or unexpected losses if you pick the wrong discount rate. This article will show you how to use a CAPM Calculator to turn that guesswork into a clear, defensible number. Every CAPM output is a reflection of your own assumptions about which gilt yield best represents risk-free duration — not a fundamental truth about the stock itself. You do not need a finance degree to follow along. We cover the formula step by step, where to source gilt yields and beta, and three common mistakes that burn real money. By the end, you will have a concrete action plan for your next investment screen.
What is a CAPM Calculator — and why should you care about yours?
Every investment decision you make already contains a hidden CAPM calculation — even if you have never typed a formula in your life. When you look at a UK share and think “that return feels too low for the risk I am taking,” or “I would need at least 8% a year to bother with this stock,” you are implicitly weighing the risk-free rate against the equity risk premium. A CAPM calculator simply makes that implicit judgement explicit. It is a tool — or a mental framework — that tells you the minimum annual return you should demand from a UK share, given how safe or risky it is compared to the overall market.
Think of it this way: if a company’s shares are riskier than the market average, you deserve a higher expected return. If they are safer, you can accept less. A capm calculator formalises that trade-off. Without it, you risk overpaying for risk or settling for a reward that barely compensates you. To see why, take a 10-year gilt yield of roughly 5.2% (the Bank of England’s 10-year par yield was 5.19% on 9 September 2026) and an equity risk premium of 4.2%. A company with a beta of 1.2 is estimated to move 20% more than the market, on average. Using the capm formula, your required return becomes approximately 10.2% annually, just to break even on the risk you are taking. Accept anything less, and you are effectively losing money in risk-adjusted terms.
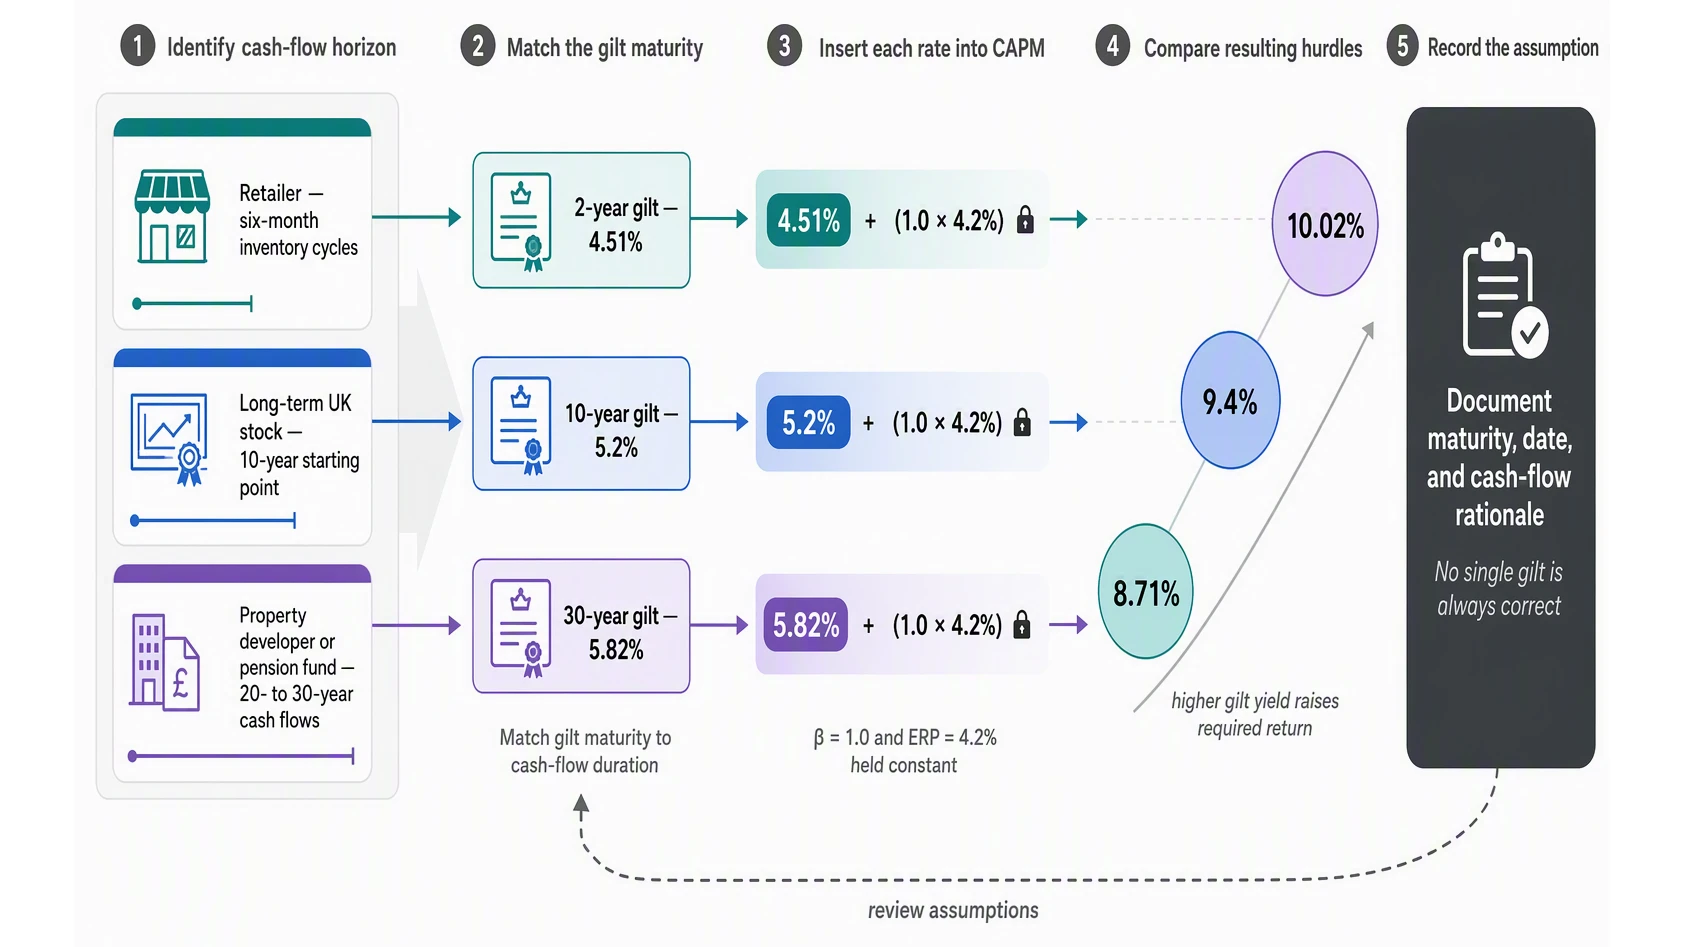
The stakes are concrete. Choosing the wrong gilt maturity (in this article’s illustrative inputs, a short-term 2-year gilt at 4.51% versus a 30-year gilt at 5.82%) changes your required return by over a full percentage point. When you compound that across a decade, the difference in expected wealth is substantial. Many investors ignore this choice entirely, assuming “risk-free” is a single number. It is not. At the time of writing (October 2026), the gilt yield curve is upward-sloping, meaning longer-dated gilts offer higher yields. Which one you pick depends on the duration of the cash flows you are valuing. A property developer with 20-year rental income streams should use a 20- or 30-year gilt. A retailer with six-month inventory cycles should use a 2-year gilt. Pick the wrong one, and your cost of equity uk calculation is misleading from the start.
Every CAPM calculator output is a reflection of your own assumptions — about which government bond best represents true risk-free duration in the UK market — not a fundamental truth about the stock itself. The UK equity risk premium is not a fixed number you look up; it is a derived belief that emerges from the tension between your gilt yield choice and your beta source. That is the single most important insight in this entire article. Over the next sections, we will demystify each input — the risk-free rate, beta, and the equity risk premium estimate — so you can use any capm calculator with genuine confidence. For a practical demonstration, ARIA PM’s free CAPM calculator takes the gilt yield, beta and expected market return you type in, so you can see how each choice moves the result.
How the CAPM formula works for UK stocks: a step-by-step, plain-English guide
At its heart, the CAPM formula — or Capital Asset Pricing Model — is a deceptively simple equation that asks one question: given the risks you are taking, what return should you reasonably expect? For UK investors, the formula looks like this:
Expected Return = Risk-Free Rate + (Beta × Equity Risk Premium)
Let us break that down with British examples.
The Risk-Free Rate: why a gilt, and which one? The "risk-free" part is the return you can get with no chance of default — in the UK, that means a government gilt. In this article’s illustrative inputs, a 10-year gilt yields around 5.2% (close to the Bank of England’s 5.19% reading for 9 September 2026), the safest pound-denominated return available for that horizon. But here is where the tension starts: the 2-year gilt is at roughly 4.51%, while the 30-year gilt is at 5.82%. That gap of over a percentage point is not a technical footnote. Choosing the wrong duration for your investment horizon directly changes your final hurdle rate. For a long-term equity holder, the 30-year gilt may be more appropriate; for a short-term project, the 2-year rate fits better. Either way, your choice is baked into the answer.
Beta: how much does the stock dance with the market? Beta measures a share's tendency to rise or fall more than the FTSE All-Share. A defensive utility company (say, National Grid) might have a beta of 0.65, meaning it typically moves about two-thirds as much as the wider market. A volatile mining stock could have a beta of 1.5, meaning it amplifies market moves by 50%. The formula multiplies this beta by the equity risk premium, so a higher beta directly demands a higher expected return.
The Equity Risk Premium: the estimate that makes it real. Professor Aswath Damodaran’s implied premium for mature markets was 4.20% on 1 October 2026. His January 2026 country data started from the 4.23% mature-market premium of that time and added 0.78% for the UK, giving a UK equity risk premium of 5.01% (the same 0.78% on top of October’s 4.20% would give 4.98%). This article’s examples use the 4.2% mature-market figure: the extra return investors expect from shares over safe gilts. This is not a published number you look up; it is a derived belief based on historical data and forward assumptions.
A worked example to make it concrete. Imagine a company with a beta of 1.0 — perfectly in line with the market. Using the 10-year gilt at 5.2%:
5.2% + (1.0 × 4.2%) = 9.4%
That 9.4% is your cost of equity — the return you must generate to compensate for the risk. Now change the gilt to the 30-year at 5.82%:
5.82% + (1.0 × 4.2%) = 10.02%
The difference is 0.62 percentage points. On a £10 million investment, that gap represents £62,000 per year in required return. The central insight here is that every CAPM output is a reflection of your own assumptions — not a fundamental truth about the stock. Tools like a CAPM calculator help you run these scenarios quickly, but understanding the inputs is what gives the number meaning. To stress-test your assumptions against different gilt yields, rerun the calculator with each one. ARIA PM’s calculator asks for the expected market return rather than the premium, so keep the 4.2% premium by entering a market return of 9.4% with a 5.2% risk-free rate, and 10.02% with 5.82%; changing only the risk-free rate at a beta of 1.0 leaves the result unchanged. Tools like ARIA PM handle the survivorship adjustment and regime testing automatically — so you focus on interpreting the result, not building the model.
Where to find your real UK numbers: gilt yields, beta estimates and risk premiums
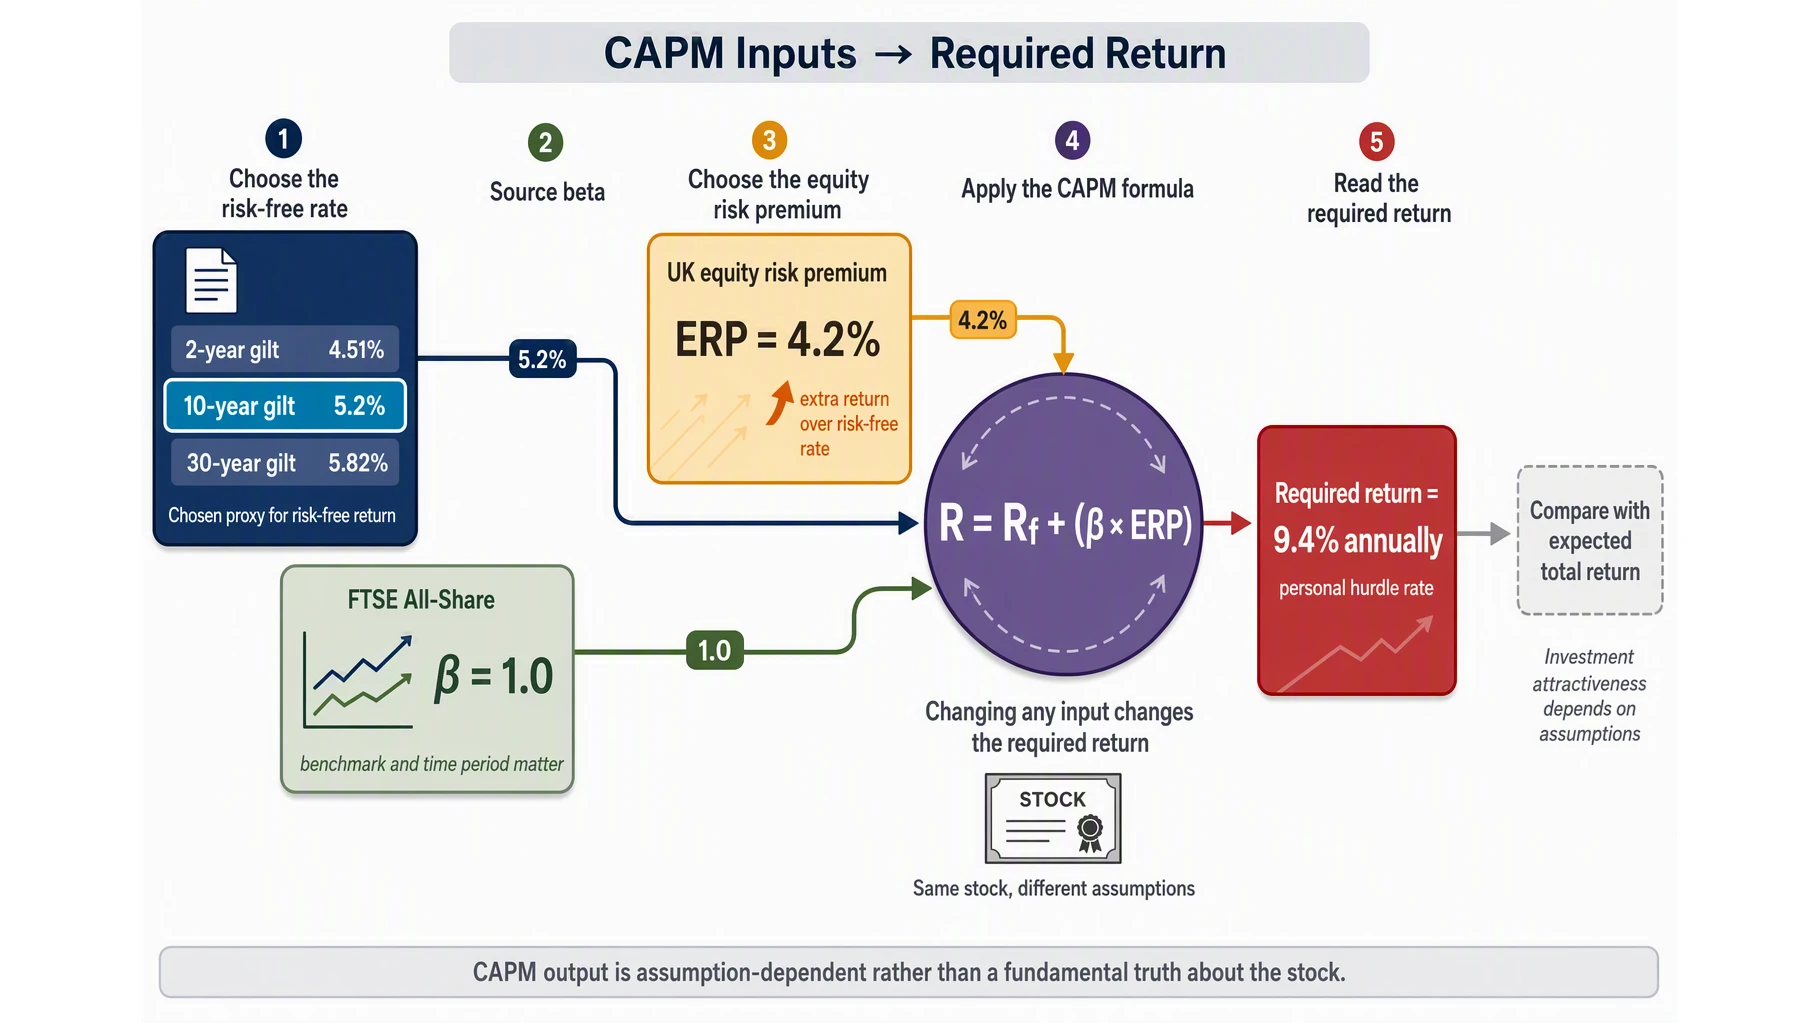
The single most important insight is that the UK equity risk premium is not a fixed number you look up, but a derived belief that emerges from the tension between the gilt yield you choose and the beta you source — meaning every CAPM output is actually a reflection of your own assumptions about which government bond best represents true risk-free duration in the UK market, not a fundamental truth about the stock itself. Let's walk through where to find each real number and why each choice matters.
Gilt yields — your risk-free rate anchor. The risk-free rate in the CAPM formula is not hypothetical; it is a live government bond yield. The Bank of England's daily yield curve publishes yields across all maturities, and the Financial Times bond pages show current trading levels. As a set of illustrative inputs, this article uses a 2-year gilt yield of 4.51%, a 10-year of 5.19% (the Bank of England’s 10-year par yield on 9 September 2026) and a 30-year of 5.82%. Which one should you use? A short-term investor might choose the 2-year; a pension fund with 30-year liabilities would pick the 30-year. For real-return calculations — where you strip out expected inflation — the UK Debt Management Office publishes yields on index-linked gilts, which adjust for RPI inflation. The DMO’s annual review put the 30-year index-linked gilt yield at 2.16% real at the end of March 2026, a very different number from the nominal 5.82% used above. Your choice directly shifts your cost of equity.
Beta — benchmark is everything. Platforms like Stockopedia report a beta, but check which index it is measured against (the FTSE All-Share is the usual UK choice). By the logic of benchmark selection, the FTSE 100 has a beta of 1.00 by definition when measured against itself: that is a property of the index as the market portfolio, not of its constituents, which sit above and below 1.00. Suppose a provider shows a FTSE 100 beta of, say, 0.32. That can be a valid number if it was measured against a different index (a global one, for example), over a different time window or with a different method. The lesson: always check which benchmark the beta refers to. If you are pricing a UK mid-cap stock, the FTSE 250 makes a more appropriate reference than the FTSE 100.
Equity risk premium — an estimate, not a published number. Professor Aswath Damodaran maintains regularly updated datasets: his implied premium for mature markets was 4.20% on 1 October 2026, and his January 2026 country table adds 0.78% for the UK. That figure represents the additional return investors expect above the risk-free rate for bearing equity risk. Do not confuse it with the UK sovereign spread over German bunds (take an illustrative 1.80%), which measures default risk between governments: a completely different concept. The equity risk premium is a judgement call. If you combine the 10-year gilt at 5.19% + beta 1.00 + a 4.2% premium, your CAPM cost of equity comes to 9.39%. Change the gilt to the 2-year at 4.51%, and it falls to 8.71%. That 68-basis-point difference can mean millions in valuation.
A practical approach: bookmark the Bank of England's yield curve page, a beta source (Stockopedia or a broker platform), and Damodaran's data page. Check them annually, or whenever gilt markets lurch, as they did on 1 September 2026 when the 30-year yield touched 5.89% intraday, its highest since 1998. Tools like ARIA PM’s CAPM calculator let you dial in your chosen gilt yield and beta in seconds, so you can see how each assumption changes your cost of equity without building a spreadsheet yourself.
Real-world CAPM in action: from Ofgem energy price reviews to your own stock screen
Ofgem’s use of the Capital Asset Pricing Model (CAPM) to set the allowed return on electricity transmission and gas networks for the RIIO-2 price control is the most consequential application of the formula you will ever see. Its CAPM estimate of the cost of equity was 4.55%, and after a 0.25-point deduction for expected outperformance the allowed baseline equity return for RIIO-2 was 4.30% (in real, CPIH-adjusted terms, at 60% gearing), setting the baseline return National Grid and other network operators earn on billions of pounds of regulated assets. The cost flows directly through to household bills. When the regulator chose that figure, it implicitly selected a gilt yield, sourced a beta from comparable companies, and made a judgement on the equity risk premium. Each assumption was a policy decision with a price tag in the millions.
Industry advisers face exactly the same tension. When gilt yields surged, the consultancy Kroll advised companies and transaction advisers to use the spot 20-year gilt yield as the risk-free rate whenever it exceeds their normalised figure — rather than a longer-term average. That single choice pushes the risk-free rate up, which raises the cost of equity and lowers the valuation the model produces — even as the underlying business risk remains unchanged. Using a 5.2% risk-free rate rather than 3.5% raises the CAPM cost of equity by roughly 1.7 percentage points before allowing for any change in beta or the equity-risk premium. That is not a rounding error — it is a reason to buy or sell a stock.
Imagine you are valuing a UK housebuilder with a beta of 1.0 (meaning it moves in line with the market). Using the 10-year gilt at 5.2% and a 4.2% equity risk premium gives a cost of equity of 9.4%. Switch to the 2-year gilt at 4.51% because you incorrectly assume ‘shorter is safer’, and the cost of equity drops to 8.71%. At 8.71%, the discounted cash flows look cheap — the stock appears undervalued. At 9.4%, those same cash flows are expensive, and you would avoid the position. The difference in your annualised return assumption on a £10,000 investment over ten years is roughly £1,506 (£24,557 at 9.4% against £23,051 at 8.71%), enough to separate a good decision from a bad one.
This is where the retail platforms stop short. Where a research platform such as Stockopedia shows you a beta, it is typically a levered beta that reflects the company’s capital structure (debt plus equity). Damodaran’s January 2026 US industry averages put money-centre banks at a levered beta of 0.76, but an unlevered beta (which strips out the effect of debt) of just 0.34. The platforms do not calculate the full CAPM for you, and they certainly do not let you toggle between a 2-year gilt and a 20-year gilt to see the effect. That work is yours. You are not a passive recipient of a number — you are the person choosing which gilt yield stands for the risk-free rate, which beta source (monthly returns over five years, weekly returns over two to five years), and which equity risk premium estimate to trust.
ARIA PM handles survivorship adjustment, cost modelling, and regime stress-testing automatically — so you can focus on interpreting results rather than building the simulation. But the core insight remains: every CAPM output is a reflection of your own assumptions about which government bond best represents true risk-free duration in the UK market. Not a fundamental truth about the stock itself.
Three CAPM mistakes that cost UK investors real money — and how to avoid them
The most expensive mistake UK investors make with a CAPM calculator is treating the gilt yield as a pure, uncontaminated risk-free number. Academics, consultancies such as Oxera, and the Competition and Markets Authority (in its 2021 water price redetermination) have argued that gilt yields contain a hidden "convenience premium." Investors accept lower yields because gilts are ultra-safe and highly liquid, meaning the yield you see in The Financial Times may underestimate the true risk-free rate by perhaps 0.5%. If you plug 4.0% into your capm formula when the honest rate is 4.5%, your cost of equity uk comes out too low — and you end up overpaying for stocks that look cheap only because your discount rate is wrong. The solution is not to adjust blindly but to be aware that your baseline is probably a fraction of a point too skinny. Cross-check your result against the Bank of England’s policy rate (3.75% since the last of four cuts in 2025, and held there on 17 September 2026) and ask yourself whether that gap feels defensible.
The second trap is grabbing a beta from the wrong source. A FTSE 100 beta of 0.32, like the example above, can be valid against another benchmark, but if you mistake it for the index’s beta against itself (which is 1.00 by definition) and feed it into your capm formula, it would tell you the entire index barely moves with its own market. That is the error to avoid. Beta depends ruthlessly on the index you choose, the time period, and whether you use daily or monthly returns. Defensive UK equities typically have a beta of 0.5-0.8, while cyclical sectors like mining or technology run 1.1-1.5+. Damodaran’s January 2026 US industry averages put money-centre banks at 0.76 and semiconductor firms at 1.52. The fix: use monthly returns over five years against a consistent benchmark.
The third mistake is double-counting country risk. Take the illustrative UK sovereign spread over Germany of 1.80%: that is a bond-market premium, not an extra equity premium. The UK is a highly rated market, and Damodaran’s January 2026 data adds only 0.78% of country risk premium for it, far less than that spread. Adding the full sovereign spread on top would push your cost of equity from 9.39% to about 11.2%, causing you to walk away from genuinely good investments. Only add a country premium if the company is unusually exposed to UK-specific economic risk. For most FTSE 100 constituents, the standard ERP is enough. To stress-test your assumptions without building your own spreadsheets, rerun ARIA PM’s free CAPM calculator with each set of inputs. ARIA PM handles survivorship adjustment, cost modelling, and regime stress-testing automatically — so you can focus on interpreting results rather than rebuilding the simulation.
Your action plan: how to use a CAPM calculator to make better investment decisions today
1. Choose your risk-free rate — and note why it matters more than you think.
Open a gilt page on the Bank of England’s website or any major data feed. For a long-term UK stock (most FTSE 350 names), the 10-year gilt yield is your natural starting point. At the time of writing (October 2026), Bank of England data put the 10-year par yield at about 5.3% to 5.4% and the 20-year at about 5.6% to 5.8%. Write down both, along with today’s date. Your choice here is the single biggest lever on your result: the difference between a short-term and a long-term gilt changes your required return by over half a percentage point. In this article’s illustrative inputs, the 10-year minus 2-year spread is 68 basis points. An upward slope like that reflects the extra yield investors demand to lend for longer, not a forecast that rates will fall. If your cash flows are long-dated, use the longer gilt. If you think the Bank of England base rate of 3.75% (October 2026) is closer to the true risk-free anchor for cash-like holdings, use that instead. There is no “correct” answer — only your reasoned judgement about what risk-free duration means for this specific stock.
2. Find your beta — but check its ancestry.
If the stock you are valuing is a FTSE 100 name, pull its beta from Stockopedia or your broker’s research tab. Note which benchmark it uses — ideally the FTSE All-Share, not a narrower index — and what time period (two years, five years). A beta of 1.0 means the stock moves in line with the market; 1.3 means it amplifies market moves by 30%. Write both the number and its source down: if you later change brokers, that beta may shift by 0.1 or more, and you will want to know why.
3. Get the equity risk premium — never guess this one.
Do not invent a number. Bookmark Professor Damodaran’s website at NYU Stern, where he publishes an implied premium for mature markets each month and updates his country risk premiums, including the UK’s, at least once a year. His mature-market figure was 4.20% on 1 October 2026, and his January 2026 table puts the UK at 5.01%, its 0.78% country risk premium added to the 4.23% mature-market premium he used then, so confirm the current estimate before you type it into any CAPM calculator. For a useful 2025 reference point, KPMG’s Q1 2025 valuation data reported a UK risk-free rate of approximately 5.15% as at 31 March 2025 — higher than the US figure of 4.78% and materially above euro-area and Swiss rates. That is a gap between two risk-free rates, not an equity premium — but it shows how much the starting point of a CAPM calculation moves between markets.
4. Calculate your required return — your personal hurdle rate.
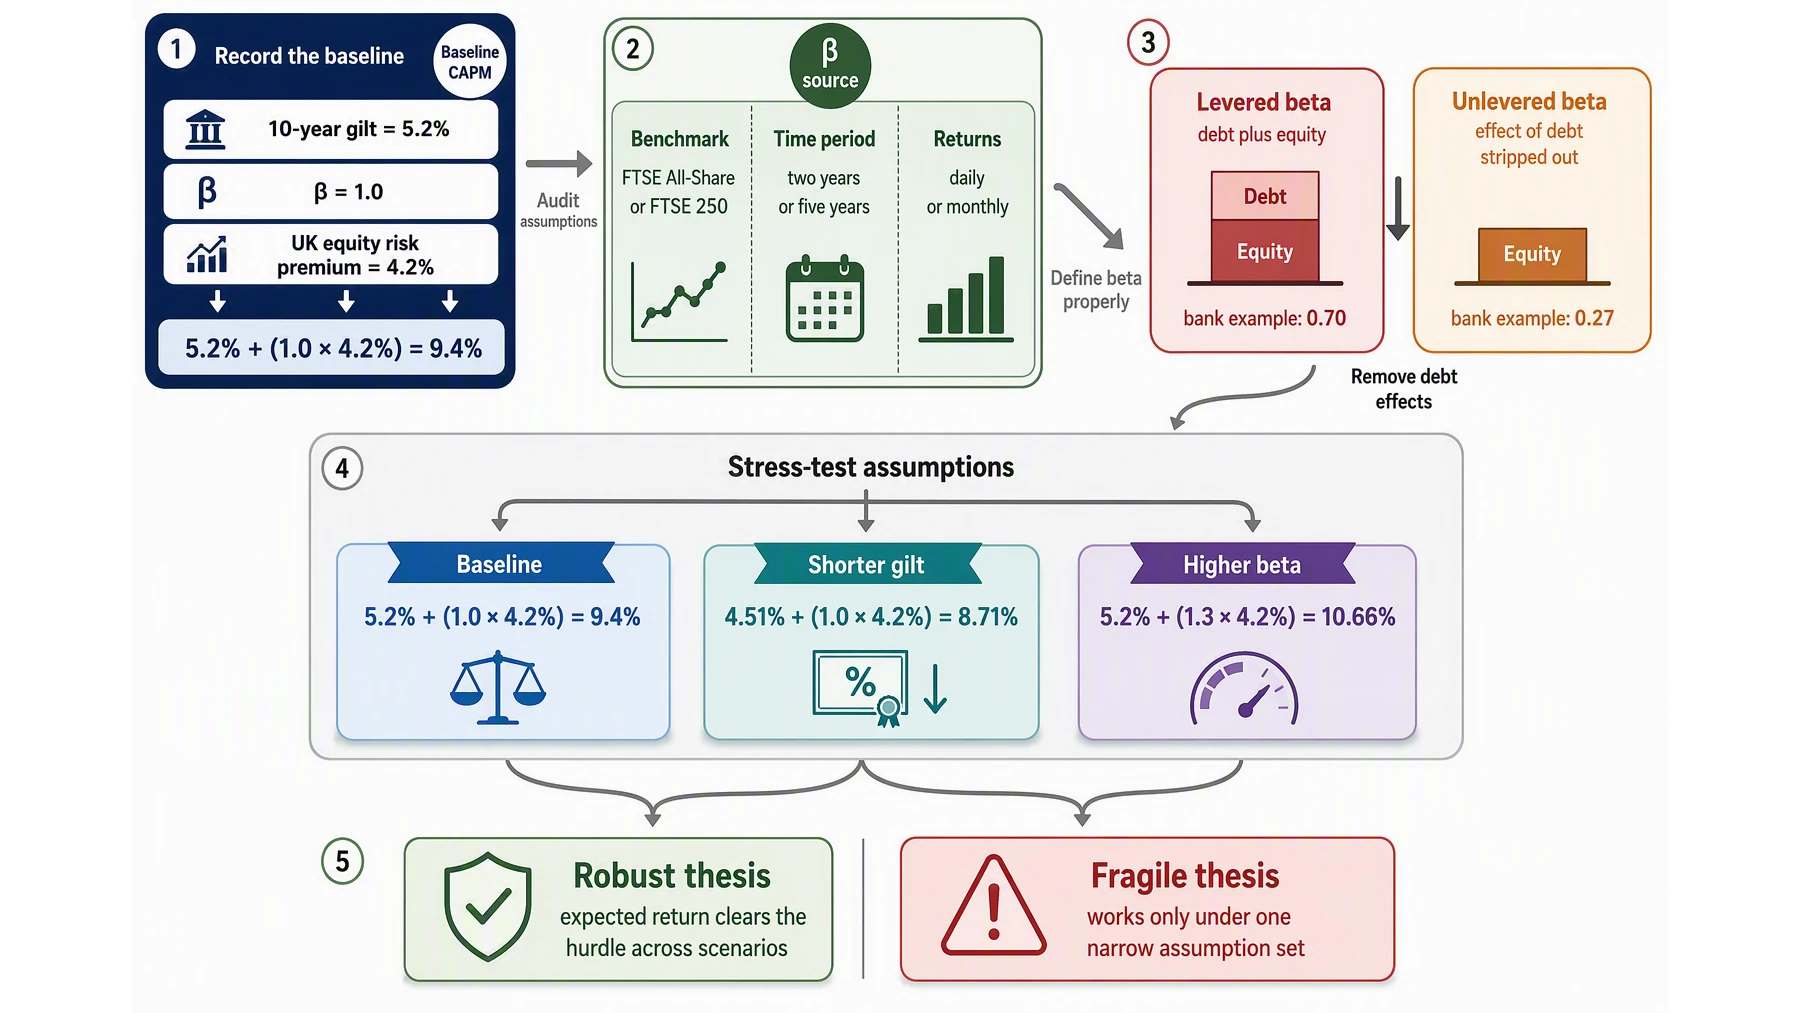
Take the formula: Risk-free rate + (Beta × Equity risk premium) . For a FTSE 100 share with beta 1.0 using the 10-year gilt: 5.2% + (1.0 × 4.2%) = 9.4%.
In ARIA PM’s CAPM calculator, which asks for the expected market return rather than the premium, that means a 5.2% risk-free rate, a beta of 1.0 and a 9.4% market return; for the 30-year case below, raise the market return to 10.02% to keep the 4.2% premium.
This 9.4% is your minimum acceptable gross return. If the share’s expected total return (dividend yield + forecast earnings growth) is below that, you are being underpaid for the risk you bear. Imagine you invested £10,000: at 9.4% a year for ten years, that grows to roughly £24,557. At 7.0% it grows to roughly £19,672, a difference of £4,885 on a single decision.
5. Stress-test your assumptions with two quick “what-ifs”.
Ask yourself: What if I had used the 30-year gilt (5.82%) instead? 5.82% + (1.0 × 4.2%) = 10.02%.
What if the beta is actually 1.3? 5.2% + (1.3 × 4.2%) = 10.66%.
If the share still looks attractive across these scenarios — say its expected return clears 11% — you have genuine conviction. If it only works under one narrow set of inputs, you have discovered a fragile thesis. ARIA PM handles survivorship adjustment, cost modelling, and regime stress-testing automatically — so you can focus on interpreting results rather than building the simulation.
6. Remember the tax bite — the number that changes everything.
Your gross 9.4% return is not what lands in your pocket. Dividends above the £500 tax-free allowance are taxed at 10.75% for basic-rate payers, 35.75% for higher-rate, and 39.35% for additional-rate (2026-27 rates). A higher-rate taxpayer receiving a 9.4% gross dividend sees roughly 6.0% after tax. Compare that to the gilt yield you could earn with lower risk, and the decision shifts. If you hold the stock inside an ISA (your £20,000 annual allowance), the full 9.4% stays with you — which is why that wrapper matters so much.
You now know more about the inputs — which gilt, which beta, which risk premium — than most casual investors. That knowledge is your protection against overpaying for risk. Run the same steps for each stock you own, and you will spot the ones paying you fairly for the uncertainty you carry.
Use the inflation calculator to see what your required return means in real terms.
Key Takeaways
- The equity risk premium you use is not a fixed number but a reflection of your choice between, in this article’s illustrative inputs, a 2-year gilt at 4.51% and a 30-year gilt at 5.82%, so every CAPM output reveals your own assumption about which bond truly represents risk-free duration in the UK market.
- Picking the wrong gilt maturity shifts your required return by over a full percentage point. Compounding that difference across a decade materially changes the expected wealth from a UK share.
- A property developer valuing 20-year rental income should match their gilt choice to that cash-flow horizon. Using a short-term gilt for long-duration assets systematically understates the required return.
- Beta from one source may embed a different market index or time window than the one you intend. Your resulting CAPM number is only as reliable as the alignment between your chosen beta and the gilt yield.
- For any UK share, if you accept a return below the CAPM output given your chosen gilt and beta, you are deliberately losing money in risk-adjusted terms. The calculator simply formalises the trade-off you already judge implicitly.
| Assumption | Option 1 | Option 2 | Impact on Cost of Equity | Typical UK Use Case |
|---|---|---|---|---|
| Risk-free rate (gilt) | Short-term gilt (e.g. 2-year yield) | Long-term gilt (e.g. 10-year or 20-year yield) | Shorter duration gives lower cost; longer duration raises it | Regulators prefer long-term; short-term suits volatile stocks |
| Gilt type | Conventional gilt | Index-linked gilt (real yield + inflation) | Index-linked typically yields lower real rate, reducing cost | More conservative for long-duration infrastructure |
| Equity risk premium (ERP) | Historic UK ERP (4-5%) | Implied ERP from FTSE 100 dividend discount models | Historic gives higher cost; implied can be lower | Regulators often use a blended range |
| Beta source | 5-year monthly beta (as Yahoo Finance shows) | 2-year weekly beta (Bloomberg’s default) | Longer window smoothes outliers; shorter captures recent risk | Regulators such as Ofgem weigh several windows; day-traders may prefer shorter |
| Market proxy | FTSE 100 | FTSE All-Share | Broader index slightly lowers beta for large caps | Most UK analysts use FTSE All-Share |
Gilt Yield Choices and Their Effect on a Real Stock (Example: National Grid)
| Gilt Type | Maturity | Illustrative Yield (%) | Assumed Beta (National Grid) | Calculated Cost of Equity (%) | Best For |
|---|---|---|---|---|---|
| Conventional | 2-year | 4.2 | 0.65 | 6.93 | Short-term trading view |
| Conventional | 10-year | 4.5 | 0.65 | 7.23 | Most FTSE 350 investors |
| Conventional | 30-year | 4.7 | 0.65 | 7.43 | Long-term infrastructure valuation |
| Index-linked | 10-year (real) | 1.1 (plus 2% inflation) | 0.65 | 5.85 | Inflation-hedged portfolios |
| Index-linked | 20-year (real) | 0.9 (plus 2% inflation) | 0.65 | 5.65 | Pension fund matching liabilities |
Hypothetical inputs, not market quotes: equity risk premium 4.2%; for the index-linked rows the real yield is converted to a nominal one with (1 + real yield) × 1.02 − 1 before adding 0.65 × 4.2%.
Sources
- dmo.gov.uk — Official UK debt office data on gilt yield history and issuance.
- Yield curves | Bank of England-the UK's central bank — Bank of England's yield curve data for UK government bonds.
- Bank Rate history and data | Bank of England Database — Historical Bank Rate data from the UK central bank database.
- Bank Rate maintained at 4% - September 2025 | Bank of England-the UK's central bank — September 2025 Bank Rate decision and monetary policy summary.
- UK 10 year Gilt Bond, chart, prices - FT.com — Live and historical chart for the UK 10-year gilt bond yield.
- UK Locks In Priciest 30-Year Gilt Yield Since 1998: Tax Rises at October Budget Now Near-Certain — News article on 30-year gilt yields and implications for UK fiscal policy.