
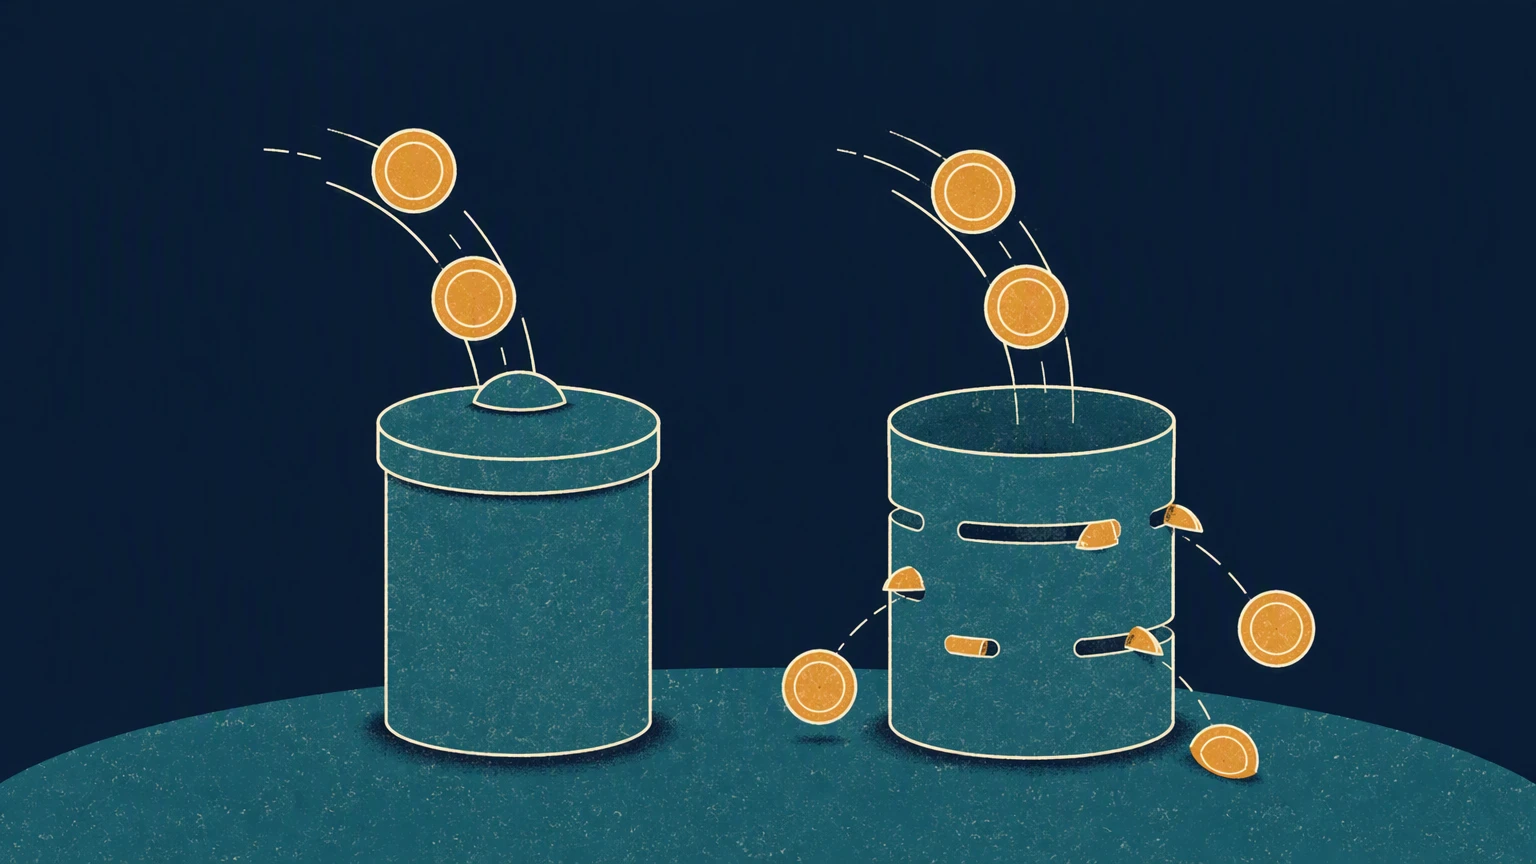
You are reinvesting dividends from a FTSE 100 holding inside a general account, assuming you are building wealth tax-free. Every single payout you plough back actually shrinks your future growth, because the taxman treats each reinvested dividend as new income. The central question is simple: does moving that same DRIP into an ISA actually transform your long-term returns, or is the wrapper overrated? This article answers that, step by step. The DRIP Calculator exposes the maths behind that choice. A DRIP inside a general account is mathematically equivalent to paying a hidden annual charge on your compounding base. Inside an ISA, those same reinvested dividends become tax-free contributions to a permanent growth engine. Over decades, the wrapper’s effect on total wealth dwarfs the dividend yield itself. No code, no jargon — just the numbers that matter for self-directed investors.
What is a DRIP calculator — and why it could save you thousands
Imagine you set up a dividend reinvestment plan UK (a DRIP ) to automatically buy more shares with every dividend your portfolio pays. You do nothing for ten years, letting the machine run. Then you log in and discover that tax has quietly been eating a slice of your growth the entire time — money that could have been compounding alongside everything else.
A DRIP is straightforward: instead of receiving dividends as cash, you use them to purchase additional shares of the same stock or fund. It turns your portfolio into an automatic compounding engine. The question is where you park that engine.
A DRIP calculator is a tool that lets you compare what happens to those reinvested dividends inside a tax-free ISA versus inside a general investment account (GIA) . The difference — the "wrapper" — is the whole story.
Here is the central insight, stated plainly: inside a GIA, reinvested dividends are still taxable. That acts like a hidden annual tax on your compounding base. Inside an ISA, the same dividends grow entirely tax-free. Over decades, the wrapper's effect on total wealth can dwarf the dividend yield itself.
Consider a £100,000 portfolio yielding 4%. For a higher-rate taxpayer in the 2026/27 tax year, dividends above the £500 allowance face 35.75% dividend tax. That costs roughly £1,251 per year in tax that leaves your account before it can reinvest. Over 20 years, that annual leak could cost over £50,000 in lost compounding — more than the yield on many portfolios.
That is why a DRIP calculator that accounts for the wrapper matters far more than chasing a slightly higher yield. Tools like ARIA PM let you model this difference without building a spreadsheet — it handles cost modelling and tax scenarios automatically, so you see the real number for your situation. For more on structuring a tax-efficient growth engine, see our Portfolio Health Check: What to Measure and How to Score Yours . Or, if you are switching platforms, read our Best Kubera Alternative for UK Investors to understand how wrapper costs compare.
The yield is not the story. The wrapper is. A DRIP calculator that ignores your tax wrapper is showing you a fantasy. One that includes it shows you your actual wealth — and that difference can save you thousands.
How a DRIP inside an ISA vs a GIA actually works — step by step
Let’s walk through the mechanics so you can see exactly where the money goes — and, more importantly, where it stops going.
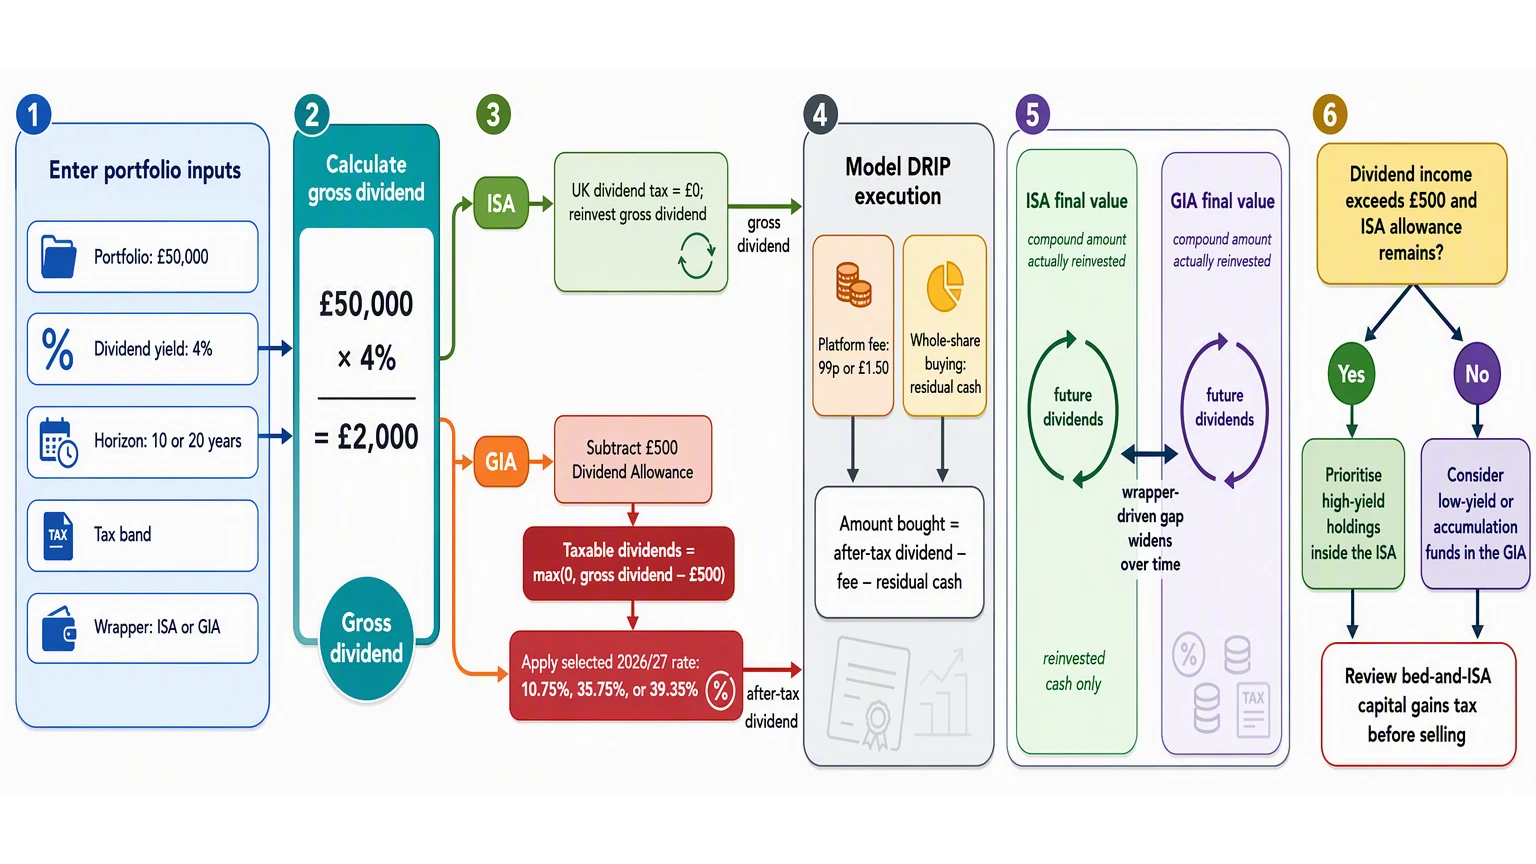
Imagine you hold a £100,000 portfolio yielding 4%. Over a year, that produces £4,000 in dividends. In an ISA, the story is simple: zero tax is due. All £4,000 is reinvested — buying more shares that will themselves pay future dividends. That full compounding base keeps working for you, untouched.
Now run the same portfolio inside a GIA (General Investment Account) . You still receive £4,000 in dividends, but the taxman has a claim. The Dividend Allowance for 2026/27 is £500, so that slice is tax-free. The remaining £3,500 is taxable. For a higher-rate taxpayer (35.75% dividend tax in 2026/27), that means £1,251.25 goes straight to HMRC. You are left with just £2,748.75 to reinvest — 31.3% less than the ISA investor.
Here is the critical point: the tax is due even though you never saw the cash as income. It is not deducted at source like PAYE. You must report it and pay it from your general funds. And a dividend reinvestment plan UK (a DRIP ) does not alter the tax treatment one bit. The dividend is taxable income regardless of whether you take it as cash or automatically buy more shares. The DRIP just changes what happens after HMRC takes its cut.
That annual leakage adds up fast. Using a DRIP calculator makes the damage visible. Assume a 6% total return (4% yield plus 2% price growth) over 20 years. The ISA grows to roughly £219,000. The GIA for a higher-rate taxpayer reaches only £168,700. That £50,000 gap is not from market returns — it is pure tax drag on reinvested dividends. Every year, a portion of your compounding base was redirected to the Treasury instead of buying new shares.
This is why running a DRIP ISA versus a taxable account is not a marginal optimisation. Over decades, the wrapper’s effect on total wealth can dwarf the dividend yield itself. The £20,000 annual ISA allowance is the critical bottleneck — and reinvested dividends inside the wrapper do not use any of that allowance, because the £20,000 limit applies only to money you pay in, not to returns generated inside the account. For a deeper look at how this compares to other portfolio tracking tools, see our guide to the Best Snowball Analytics Alternative for UK Investors.
The lesson is stark: a DRIP in a GIA is mathematically equivalent to paying a hidden annual tax on your compounding base. The same DRIP inside an ISA turns your reinvested dividends into tax-free contributions to a permanent growth engine. If you are running a Portfolio Health Check: What to Measure and How to Score Yours, the wrapper should be your first diagnostic question — not the fund choice or the yield.
DRIP in practice: real platforms, real numbers
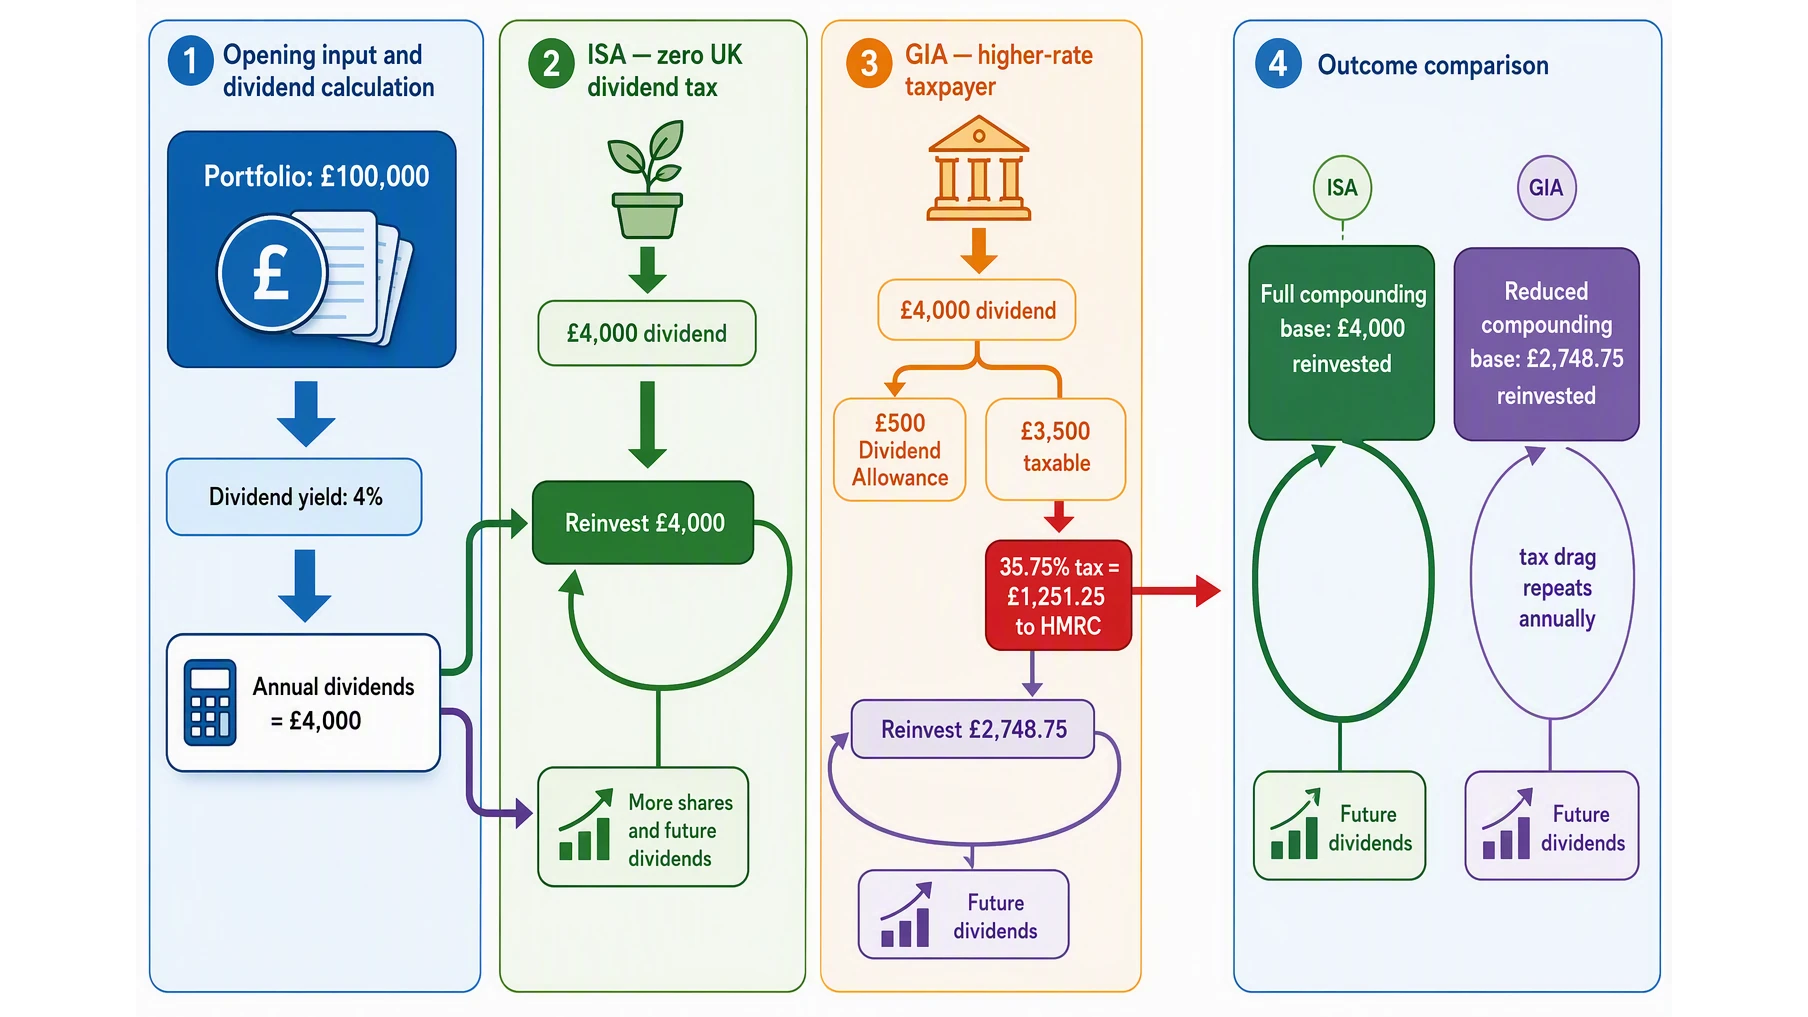
When you move from theory to practice, the platform mechanics differ, but the tax principle remains brutally consistent. Consider Interactive Investor , which charges 99p per DRIP transaction. Imagine you receive a £100 dividend inside an ISA. After the fee, roughly £99 is available to reinvest — no further UK dividend tax applies. Now run that same £100 dividend through a Trading Account (a general investment account, or GIA) as a higher-rate taxpayer using the 2026/27 rates. The tax calculation is sobering. You first subtract the fee: £100-£0.99 = £99.01. Then you apply the 35.75% dividend tax on the full £100 (your £500 allowance is already used), leaving just £63.26 to reinvest — a staggering 37% of your capital lost to tax and a tiny fee. That is dividend tax drag in its purest form: a permanent reduction in your compounding base.
AJ Bell adds another wrinkle. They charge £1.50 per DRIP trade and buy only whole shares, leaving residual cash uninvested. In an ISA, a £250 dividend less the £1.50 fee leaves £248.50; at a £5 share price that buys 49 shares for £245, leaving £3.50 in cash. In a GIA the same dividend is taxed at 35.75% first, leaving roughly £160.63 — enough for 32 shares at £5, spending £160.00, with £0.63 left over as residual cash that earns nothing. That idle cash is a small but persistent drag on growth. In an ISA, the same £250 dividend might buy 49 shares at £5, with just £3.50 leftover — but no tax was taken off the top, so your reinvestment base stayed larger all along.
Then there are Vanguard's accumulation funds , which automatically reinvest dividends internally. In a GIA, that notional distribution is still taxable, even though no cash reaches your account. You must manually track the deemed dividend and report it to HMRC — a real record-keeping burden that catches many investors off guard. Inside an ISA, that complexity vanishes entirely.
For those already sitting on a GIA, Hargreaves Lansdown's bed-and-ISA process can move holdings into the tax wrapper. But selling triggers Capital Gains Tax if your gains exceed the £3,000 annual exempt amount — a painful sting at 24% for higher-rate taxpayers. Use a Portfolio Health Check: What to Measure and How to Score Yours before triggering a sale, and consider a Vat Calculator for unrelated VAT checks. The bottom line: platform fees and mechanics vary, but the tax principle is universal — over decades, the wrapper’s effect on total wealth can dwarf the dividend yield itself.
The real cost of ignoring the wrapper: three common DRIP mistakes
Three concrete pitfalls show why ignoring the wrapper costs real money.
First mistake: assuming reinvestment makes dividends tax-free. Many investors believe that because they never see the cash — it buys new shares automatically — no tax is due. That is false. HMRC has made clear that dividends reinvested in a general account (GIA) are taxable as income "in the same way as if they had been distributed." Your DRIP calculator must account for this: a £10,000 portfolio yielding 4% inside a GIA generates £400 of dividend income. With the £500 allowance for 2026/27, a single holding of that size stays shielded — but once any portfolio breaches that threshold, every extra pound is taxed at your marginal rate. Over a decade, that tax compounds silently against you.
Second mistake: ignoring foreign withholding tax. For US shares held inside an ISA, the 15% US withholding tax is typically unrecoverable — the double-tax treaty reduces it from 30% to 15%, but HMRC offers no mechanism to reclaim that lost portion inside the ISA wrapper. In a GIA, you can claim foreign tax credit relief against your UK dividend tax bill, slightly narrowing the advantage. This does not erase the ISA benefit — the remaining 85% of the dividend still grows tax-free — but it means an ISA for global equities requires careful modelling. A good dividend reinvestment plan UK tool that tracks withholding by country prevents you from overstating your net yield.
Third mistake: filling your ISA with low-yield growth stocks while leaving high-yield REITs or bond funds in a GIA. This is the cardinal sin of "asset location." A 4%-yielding portfolio exhausts the £500 dividend allowance at just £12,500 of invested capital. Most income portfolios above that size in a GIA are bleeding tax unnecessarily. The most tax-inefficient assets — high yield, high turnover — should get priority for your £20,000 annual ISA allowance. Put your Real Estate Investment Trusts (REITs) and bond funds inside the wrapper; growth stocks, with lower dividends and deferred capital gains, can sit outside. Run a drip isa simulation on a platform like ARIA PM to see the difference: the wrapper effect on total wealth after 20 years often dwarfs the dividend yield itself. As we cover in the Portfolio Health Check: What to Measure and How to Score Yours, asset location is a core diagnostic — get it wrong and your tax bill rises far more than your returns.
How to use a DRIP calculator to make smarter decisions for 2026/27
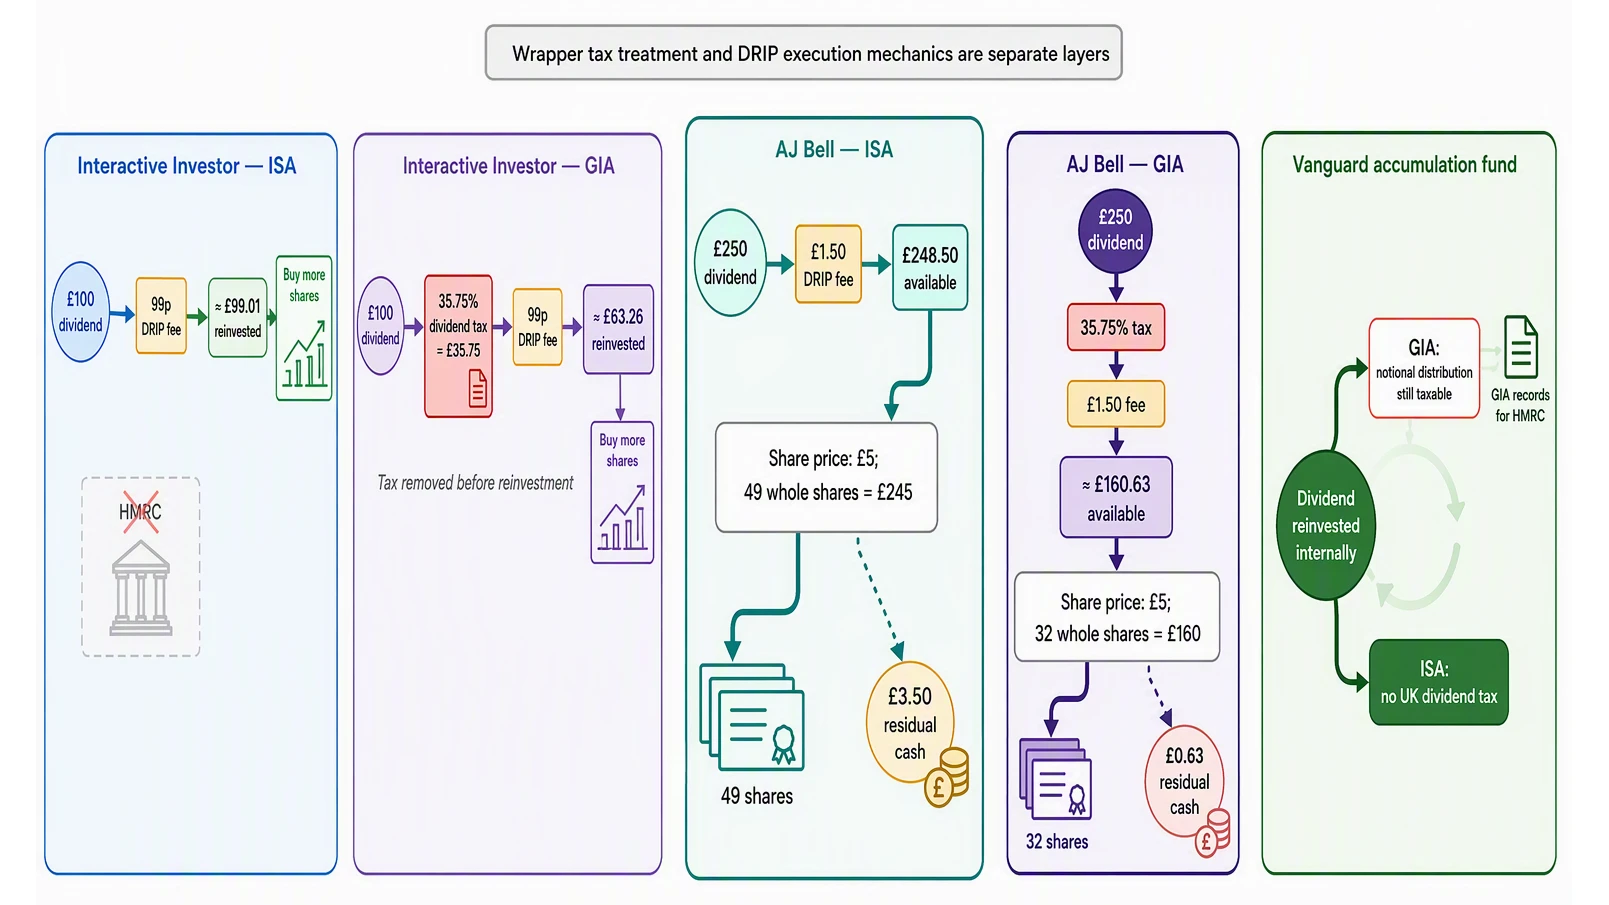
A good DRIP calculator should let you toggle between an ISA and a general investment account (GIA) , select your tax band, and adjust for the 2026/27 dividend tax rates (10.75%, 35.75%, 39.35%) alongside the £500 allowance. It should also model platform fees — 99p or £1.50 per reinvestment — and cash drag from whole‑share buying, where uninvested pennies sit idle. Take a concrete scenario: you input £50,000 with a 4% dividend yield, you’re a higher‑rate taxpayer, and you set a 10‑year horizon. The calculator should display the ISA value versus GIA value after all fees and tax. In the GIA, once you’ve used the £500 allowance, each £100 dividend is taxed at 35.75%, leaving £64.25 — but after the 99p reinvestment fee, only about £63.26 actually buys new shares. That eroded base compounds at a slower rate, so after 20 years the gap widens dramatically: industry research shows a £100,000 portfolio with a 4% yield grows to approximately £219,112 inside an ISA versus £168,725 for the higher‑rate GIA holder. That is a difference north of £50,000 — entirely driven by the wrapper.
Three UK tools worth trying: Dividend Registry’s UK DRIP calculator, UKCalculator’s reinvestment tool, and Openbook’s dividend calculator. Each makes different assumptions about fee timing and tax‑year boundaries, so always review the fine print before trusting the output. ARIA PM handles survivorship adjustment, cost modelling, and regime stress‑testing automatically — so you can focus on interpreting results rather than building the simulation.
Your decision rule is straightforward: if your dividend income exceeds £500 a year and you have ISA allowance left, prioritise moving those holdings inside the ISA. Every penny that would have been lost to the taxman becomes a tax‑free contribution to your compounding engine. If your ISA is already full, consider low‑yield or accumulation funds in the GIA instead of high‑dividend stocks — you minimise the annual tax drag without wasting your limited tax‑free room. You can also use a Lifetime Isa Calculator to see how the £20,000 allowance fits with other savings goals, or check your portfolio’s tax efficiency with a Portfolio Health Check. The wrapper is the whole story — the dividend yield itself is merely the starting point.
Your next move: three steps to tax-efficient dividend reinvestment today
This is the moment where theory meets your portfolio. The single most important insight is that a dividend reinvestment plan inside a general investment account (GIA) is mathematically equivalent to paying a hidden annual tax on your compounding base, while the same DRIP inside an ISA turns your reinvested dividends into tax-free contributions to a permanent growth engine. Over decades, the wrapper’s effect on total wealth can dwarf the dividend yield itself.
Consider a portfolio yielding 4%. HMRC’s dividend allowance for 2026/27 stands at just £500. Once your portfolio exceeds £12,500, most of your dividends become taxable in a GIA — at 10.75% for a basic-rate taxpayer or 35.75% for a higher-rate taxpayer. That tax is money that never gets reinvested, never compounds, and never works for you again. Inside an ISA, the full gross dividend buys more shares, every time. Industry research from HMRC shows total adult ISA holdings reached £872 billion by April 2024, with roughly £511 billion in stocks-and-shares ISAs — a vast pool of capital already benefiting from this compounding advantage. Your goal is to join it.
Step 1: Check your current holdings. Log into your platform and see which accounts hold dividend-paying shares. If they sit in a GIA and you have ISA allowance left for 2026/27, consider transferring via a bed-and-ISA — but be mindful of capital gains tax on gains above the £3,000 annual exempt amount. If you are unsure how the tax drag on those holdings measures up, use a Best Free Portfolio Tracker UK: What You Actually Get Without Paying to visualise your exposure.
Step 2: Use a DRIP calculator with your actual numbers. Input your portfolio size, yield, tax band, and platform fees to quantify the annual tax drag. ARIA PM handles survivorship adjustment, cost modelling, and regime stress-testing automatically — so you can focus on interpreting results rather than building the simulation. A concrete example: £10,000 at 8% annual growth for 10 years grows to £21,589 inside an ISA. If a 0.5% annual tax drag (from dividend tax and SDRT) reduces that return to 7.5%, the same sum grows to £20,610 — a £979 difference from one decade alone. Over thirty years, that gap becomes many thousands.
Step 3: Set up DRIP inside your ISA first. For platforms like Interactive Investor and AJ Bell, activate the reinvestment feature within the ISA wrapper. If you use accumulation funds (e.g., Vanguard FTSE Global All Cap), ensure they are held inside the ISA to avoid notional distribution tax. Remember, the £20,000 annual ISA limit is use-it-or-lose-it — unused allowance cannot be carried forward.
The bottom line is stark: for a long-term investor, the single most powerful move is to let your dividends compound inside a tax-free wrapper, not a taxable one. Check your holdings, quantify the drag, move the money. Then let compounding do the rest.
Key Takeaways
- Inside a general account, reinvested dividends shrink your compounding base each year by the tax you pay on them, making a DRIP there a hidden annual drag on total wealth.
- For a higher-rate taxpayer with a £100,000 portfolio yielding 4%, the £1,251 annual dividend tax above the £500 allowance leaks out before it can compound, costing over £50,000 in lost growth across 20 years.
- A DRIP inside an ISA turns every reinvested dividend into a tax-free addition to your permanent growth engine, so the wrapper's effect over decades can outweigh the dividend yield itself.
- Using a DRIP calculator that accounts for the tax wrapper matters more than chasing a slightly higher yield, because the annual tax leak from a general account dwarfs typical yield differences.
Table 1: Year One Impact of a £100,000 Portfolio Yielding 4%
| Factor | DRIP inside an ISA | DRIP inside a GIA |
|---|---|---|
| Dividend received | £4,000 | £4,000 |
| Covered by the £500 dividend allowance | n/a — no tax either way | £500 |
| Taxable dividend | £0 | £3,500 |
| Tax due (basic rate, 10.75%) | £0 | £376.25 |
| Net reinvested into new shares | £4,000 | £3,623.75 |
| Tax on future growth of reinvested dividends | None | Compounded tax on each future dividend |
Table 2: The Same £100,000 After 20 Years
Dividends reinvested each year at a 4% yield, no capital growth, so the only difference is the tax wrapper. The GIA figures apply the £500 allowance first, then 10.75% to the rest.
| Metric | ISA (tax-free DRIP) | GIA (taxable DRIP) |
|---|---|---|
| Dividends reinvested over 20 years | £119,112 | £103,219 (after tax) |
| Cumulative dividend tax paid | £0 | £11,228 |
| Final portfolio value | £219,112 | £203,219 |
| Compound annual growth rate | 4.00% | 3.61% |
| Hidden annual cost of the wrapper | 0% | 0.39 percentage points a year |
Table 3: Common DRIP Mistakes and How the Wrapper Fixes Them
| Mistake | GIA outcome | ISA outcome |
|---|---|---|
| Assuming reinvestment makes dividends tax-free | Tax still due on dividends above the £500 allowance, at 10.75% or more | No tax due at any level |
| Using a DRIP calculator without a wrapper toggle | Overestimates final value by ignoring tax drag | Accurate reflection of tax-free compounding |
| Ignoring the £500 dividend allowance erosion | High-yield portfolios quickly exceed the limit | No allowance limit applies |
| Forgetting platform DRIP fees (e.g. Interactive Investor 99p per trade) | Tax + fees double-hit on small dividends | Only platform fee applies, no tax |
Sources
- The Individual Savings Account (Amendment) Regulations 2026 — Amends ISA regulations effective from 2026, affecting tax-free savings rules.
- Annual savings statistics 2025 - GOV.UK — Provides 2025 statistics on ISA uptake and total savings across accounts.
- Commentary for Annual savings statistics: September 2025 - GOV.UK — Offers commentary on 2025 savings trends, including ISA and dividend data.
- Annex A: rates and allowances - GOV.UK — Lists 2025 tax rates and allowances, including dividend and capital gains thresholds.
- Capital Gains Tax rates and allowances - GOV.UK — Details current CGT rates and annual exempt allowance for UK investors.
- Tax on dividends: Check if you have to pay tax on dividends - GOV.UK — Explains dividend tax rules, allowances, and when tax becomes payable.