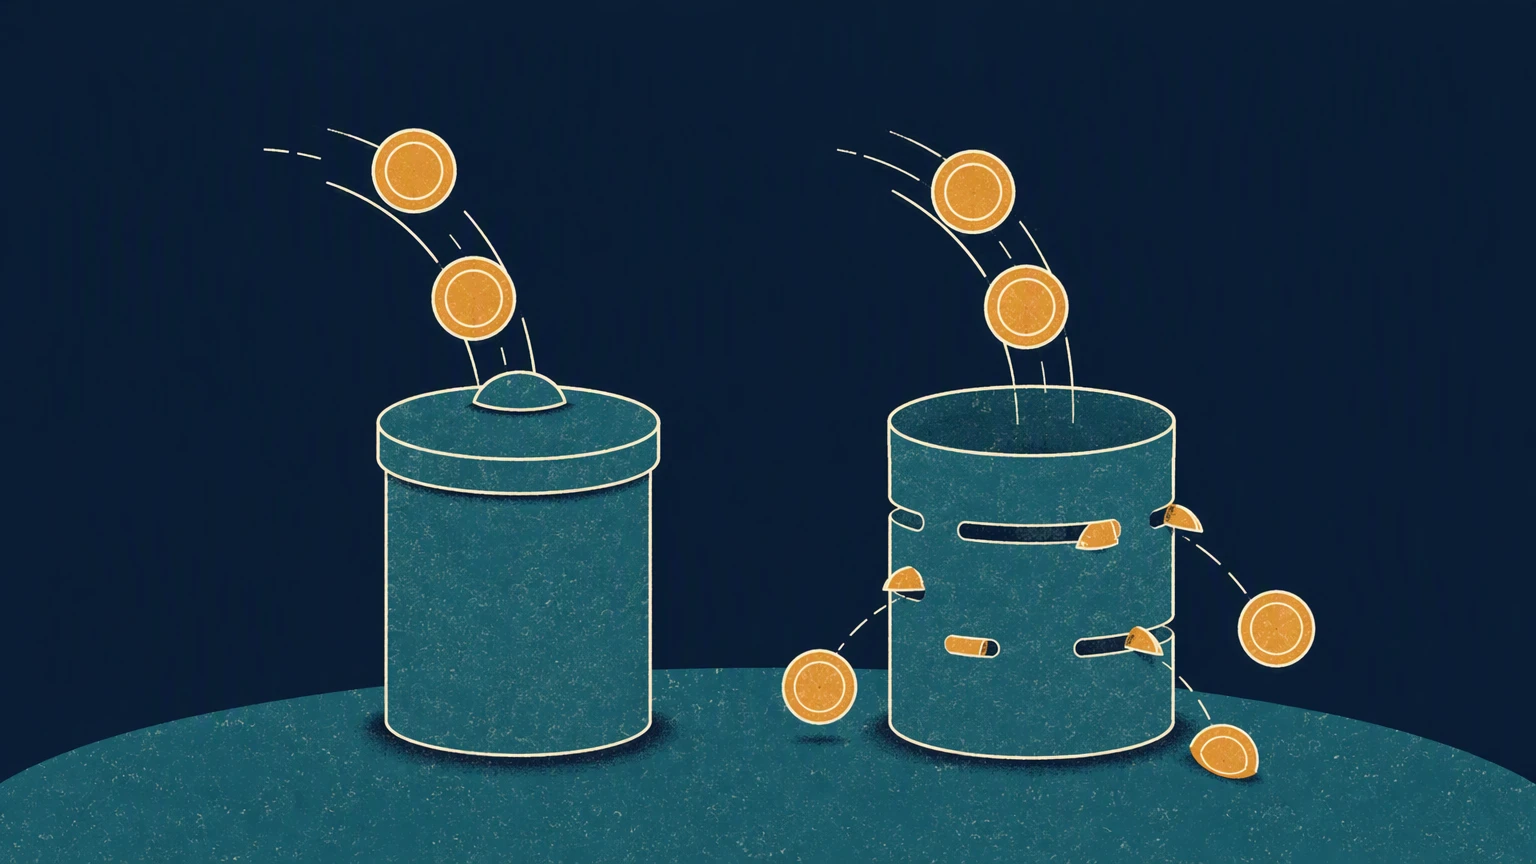

Sarah, a self-employed graphic designer, watched her SIPP grow steadily while her general investment account lagged — even though the same stocks paid identical dividends. That gap widens not linearly, but geometrically. A Dividend Reinvestment Calculator reveals the culprit: outside a tax wrapper, every dividend is taxed before it buys new shares, shrinking the compound base itself. Your money loses the ability to grow on the full amount. This article explains exactly how a Dividend Reinvestment Calculator exposes the arithmetic behind that silent tax drag. You will learn how to model the true post-tax growth of a UK portfolio, spot the platform fee traps, and apply a simple six-step action plan to keep compounding working for you — not against you. No code, no jargon. Just the numbers that matter to a self-directed investor.
What a dividend reinvestment calculator actually tells you
Let’s get one thing straight from the start: reinvesting dividends outside a tax wrapper does not merely slow your compounding — it redefines the compound base itself. Every time you take a gross dividend, pay tax on it, and reinvest what remains, you are shrinking the principal that will earn future returns. That shrinking happens every quarter, every year, for every dividend payment. The gap between a taxed account and an ISA therefore widens at a geometric rate, not an arithmetic one.
A dividend reinvestment calculator is, in plain English, a projection tool. It models how reinvesting your cash dividends — rather than pocketing them — can grow your portfolio over time. For a UK investor, the calculator must be tax-aware. It needs to handle the £500 dividend allowance for the 2026/27 tax year, and then apply the correct tax rates above that threshold: 10.75% for basic-rate payers, and 35.75% and 39.35% for higher and additional-rate taxpayers respectively. Without this, the projection is misleading.
The data shows why this matters. Industry research from Schroders found that £1,000 invested in the FTSE 100 with dividends reinvested grew to approximately £2,222 over 20 years. The same investment measured on the FTSE 100 price index alone — dividends excluded — grew to just £1,088. That is the compounding miracle — on paper. But the calculator reveals what happens after UK tax takes its bite. For a basic-rate taxpayer outside an ISA, a dividend above the £500 allowance loses 10.75% of its value before it can be reinvested. That lost percentage is not merely a deduction from returns — it is a permanent subtraction from the capital base that would itself compound. Over decades, this geometric erosion is devastating.
This is the insight the calculator should make visible. It shows you, concretely, how much of the compounding advantage survives in a taxable account. For many investors, the answer is: far less than expected. That is why using a tool like ARIA PM — which handles survivorship adjustment, cost modelling, and regime stress-testing automatically — allows you to focus on interpreting the results rather than building the simulation yourself. You can also compare your portfolio’s performance against benchmarks using a Portfolio Historical Performance: How to Analyse Your Returns framework. Understanding the gap between gross and net returns is the first step to deciding whether an ISA allowance is worth protecting.
The bottom line: a dividend reinvestment calculator for UK investors is not a simple “more vs less” comparison. It is a compound-erosion calculator. It tells you how much tax, not time, determines your long-term wealth.
How dividend reinvestment actually works in a UK portfolio
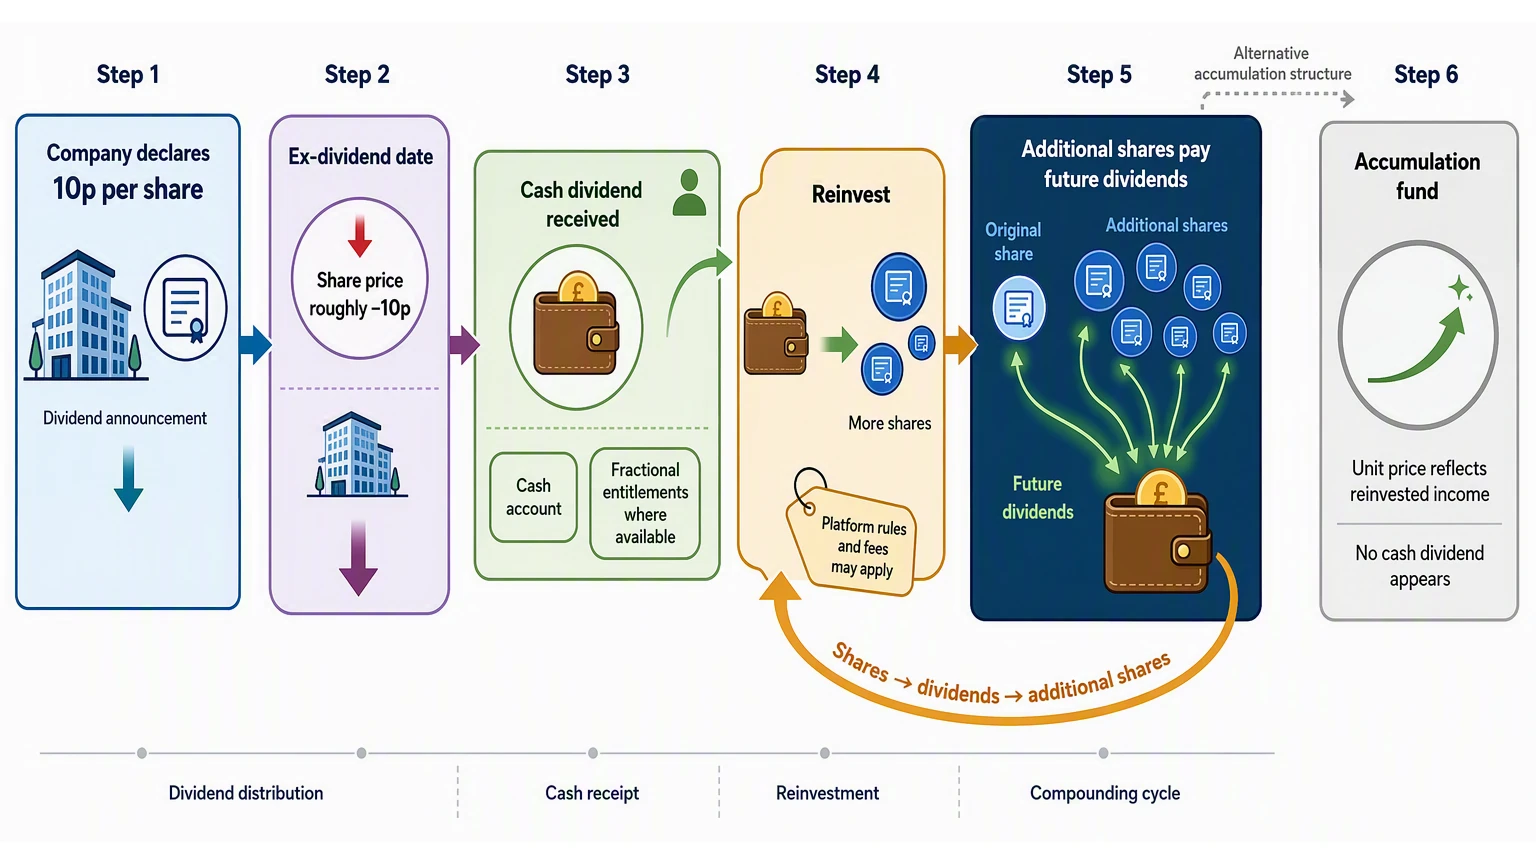
Let’s walk through what actually happens when a dividend lands in a UK portfolio outside an ISA or SIPP. A company like one in the FTSE 100 declares a dividend of, say, 10p per share. On the ex-dividend date, the share price typically falls by roughly that 10p — the market adjusts because the cash that was part of the company’s value is now leaving it. You then receive cash (or, with some brokers, accumulate fractional entitlements).
If you reinvest, that cash buys more shares. Those new shares will themselves pay future dividends, which in turn buy still more shares. That is the core of compounding in action: your income-generating base grows with each cycle. The dividend yield on UK equities — the annual dividend income as a percentage of your portfolio’s value — has historically run around 3.3% to 3.4%, according to industry research. That yield compounds powerfully over time, assuming dividends and share prices hold steady.
However, the mechanics differ by platform. Hargreaves Lansdown reinvests dividends of £10 or more per holding with no extra fee. AJ Bell charges £1.50 per reinvestment and buys whole shares only — meaning any leftover cash sits idle. Interactive Investor charges 99p with a £10 minimum per holding. If you use accumulation funds — such as Vanguard’s FTSE 100 Index Unit Trust — the process is fully automated: no cash dividend ever appears in your account, and the unit price rises to reflect the reinvested income.
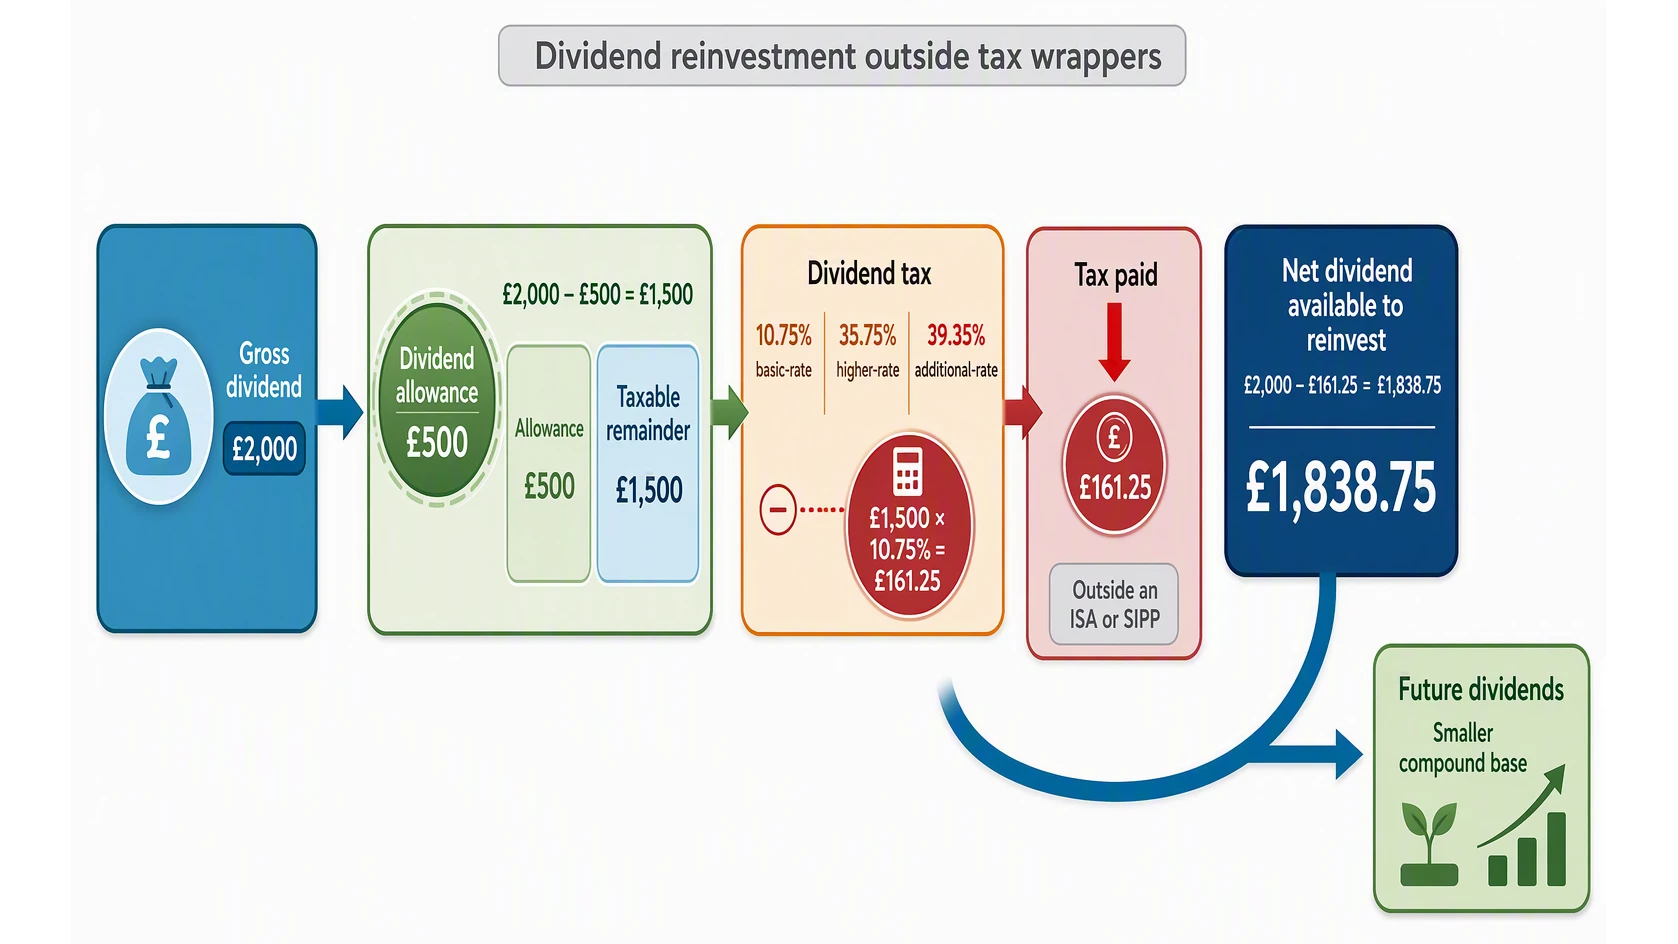
Here is the critical tax twist. HMRC treats the dividend as received even if reinvested. You cannot escape the tax by choosing to buy more shares. For the 2026/27 tax year, imagine you receive £2,000 in dividends. The tax-free allowance is £500, leaving £1,500 taxable. A basic-rate taxpayer pays 10.75% on that £1,500 — £161.25 in tax. That leaves only £1,838.75 to reinvest, not the full £2,000. This is the ‘redefined compound base’ the central thesis describes: you are not merely losing 8% of one year’s income — you are permanently shrinking the principal that generates all future dividends. The gap between a taxed account and a tax wrapper therefore widens at a geometric, not arithmetic, rate.
A dividend reinvestment calculator designed for UK tax can show you this effect in pounds and pence rather than abstract percentages. For a deeper look at how your portfolio’s total return measures up, see our guide on Portfolio Historical Performance: How to Analyse Your Returns. And if you are comparing how different platforms handle reinvestment costs, our piece on the Best Morningstar Portfolio Manager Alternative for UK Investors may help. A regular Portfolio Health Check: What to Measure and How to Score Yours is also essential for monitoring whether your compounding is on track.
Using a dividend reinvestment calculator: your step-by-step guide
Let’s walk through a real example using a dividend reinvestment calculator so you can see, in hard numbers, what happens to your compounding when UK tax applies outside a wrapper.
Start by gathering the inputs you’ll need. A reliable calculator asks for: your current portfolio value, the annual dividend yield (the UK market average is 3.3-3.4%), the number of years you plan to reinvest, your expected dividend growth rate (companies typically raise payouts 2-4% annually), and — critically — your tax band. You also need to specify whether the account is an ISA/SIPP or a taxable account.
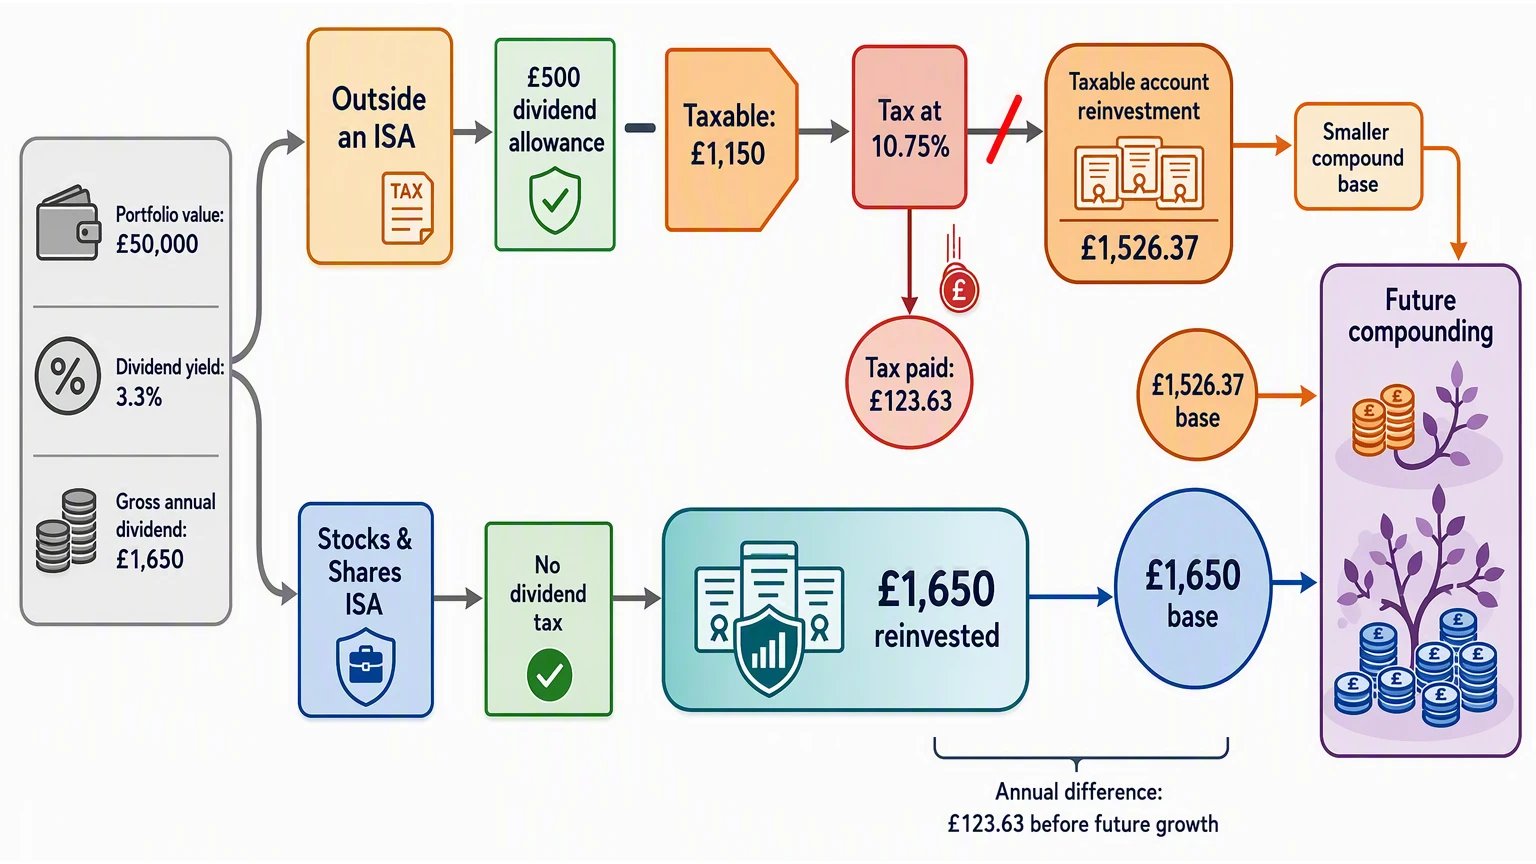
Assume a £50,000 portfolio yielding 3.3% . That’s £1,650 in gross dividends per year. In a taxable account for the 2026/27 tax year, the dividend allowance (Concept 5) is just £500. As a basic-rate taxpayer, the dividend tax rate (Concept 6) is 10.75% on dividends above that allowance. Your calculation: (£1,650-£500) × 10.75% = £123.63 in tax. That leaves only £1,526.37 to reinvest. In an ISA, you reinvest the full £1,650.
Now, punch those figures into a calculator. Three UK-specific tools do this: UKCalculator, Dividend Registry, and ProsperMath. These are commercial tools (not government-approved) that let you toggle tax scenarios. You’ll want to run the same portfolio through twice — once as taxable, once as ISA — and compare the projected values at 10, 20, and 30 years. The gap is not linear; it’s geometric. Over 10 years you might see a difference of several thousand pounds. At 20 years it widens to tens of thousands. At 30 years it can exceed £100,000. The brutal reason: tax does not merely take a slice each year — it reduces the principal that will itself compound in every future year.
The single most important metric to watch on any dividend reinvestment calculator is what you could call the ‘tax drag ratio’ — the percentage of each dividend pound lost to the Exchequer before it reaches your reinvestment pot. In this example, £123.63 lost from £1,650 is a 7.5% tax drag each and every year. Over three decades, that’s a compounding penalty you can see in vivid red on the tool’s output chart.
For a practical edge, ARIA PM handles survivorship adjustment, cost modelling, and regime stress-testing automatically — so you can focus on interpreting results rather than building the simulation from scratch. Monitoring your tax drag alongside metrics like your portfolio historical performance or running a regular portfolio health check will show you exactly how much of your compounding advantage survives outside a tax wrapper. The answer, as the numbers prove, is less than you might think — and the longer the period, the more tax rewrites the arithmetic.
Real-world examples: DRIPs, platforms, and the tax trap in action
Here is the "Real-world examples: DRIPs, platforms, and the tax trap in action" section for the article.
The mechanics of dividend reinvestment seem straightforward, but the UK tax system twists them into something far more treacherous. Consider a real-world scenario at Hargreaves Lansdown. A £12 dividend hits your account and their automatic reinvestment service buys fractional shares with no fee — every pound goes back to work. Compare that with a smaller £7 dividend. That sum sits as uninvested cash until it reaches the £10 threshold. During that waiting period, the cash earns nothing. You have a dead asset, a "cash drag" that has already been taxed, and the compounding clock has stopped.
Over at AJ Bell, the story gets worse. Their Dividend Reinvestment Plan (DRIP) charges £1.50 per reinvestment. A £100 dividend becomes £98.50 of working capital — a 1.5% friction before you even start. But the real trap is the share price. If the stock costs £50, the platform buys one whole share for £50 and returns the remaining £48.50 to you as cash. You now have a half-empty reinvestment and a tax liability on the full £100 dividend. Interactive Investor charges a cheaper 99p fee, which reduces the drag but does not eliminate the structural problem: dividend reinvestment outside a tax wrapper does not merely slow compounding — it redefines the compound base itself.
The most elegant solution is the accumulation fund. A Vanguard FTSE 100 Index Unit Trust (0.06% OCF) reinvests dividends internally, inside the fund. There is no cash drag, no missing fractional shares, and — crucially — no tax event inside a Stocks & Shares ISA. The dividend is absorbed into the unit price without generating a taxable distribution for you.
Now contrast that with the taxable account trap. Use the Computershare DRIP for a holding in Aviva or GSK. The DRIP buys whole shares automatically, but HMRC still treats that dividend as income. You owe dividend tax on the full amount — £500 tax-free allowance for 2026/27, then 10.75% (basic rate), 35.75% (higher), or 39.35% (additional). The dividend is reinvested, yes, but the tax bill comes out of your pocket elsewhere. Your compound base just shrank.
The historical context makes the cost vivid. Industry research on the FTSE 100 from 1999-2019 shows the price index returned just 0.4% annually. With dividends reinvested, that figure jumped to 4% — a tenfold difference. In a taxable account, however, that 4% becomes something less. How much less? That is the question a dividend reinvestment calculator answers with precision. For a higher-rate taxpayer reinvesting £10,000 in a diversified portfolio, the gap between a taxed account and an ISA widens at a geometric, not arithmetic, rate year after year. Tools like ARIA PM model that decay automatically, survivorship-adjusted, so you see the real cost of the tax trap — not a theoretical projection.
To understand how this erosion compounds across your entire portfolio, run a Portfolio Health Check: What to Measure and How to Score Yours that includes tax-adjusted returns. If you are comparing platforms for their DRIP efficiency, the Best Morningstar Portfolio Manager Alternative for UK Investors outlines which tools handle these cost simulations natively. For a broader view of how dividend drag interacts with inflation, pair your analysis with an Inflation Rate Calculator to see whether your post-tax reinvestment is keeping pace with rising prices.
Five costly mistakes UK investors make with dividend reinvestment
Let’s be clear: reinvesting dividends sounds like a no-brainer — more shares, more future dividends, more compounding. But outside a tax wrapper, the arithmetic is far less forgiving. Here are the five costly mistakes UK investors make with dividend reinvestment.
Mistake 1: Assuming reinvestment is always beneficial
Automatic DRIPs buy shares on a fixed schedule, regardless of valuation or business quality. This matters because a high yield is often a warning sign, not a gift. As Elston Consulting has warned, ‘high yield is not high quality.’ Reinvesting into a struggling company that cuts its dividend later doesn't accelerate compounding — it locks in capital losses. A dividend reinvestment calculator that doesn’t flag this treats all dividends as equal, which they are not.
Mistake 2: Ignoring the tax until it’s too late
Consider a higher-rate taxpayer with a £100,000 portfolio yielding 3.4% — generating £3,400 in dividends. Under HMRC’s current guidance, the £500 allowance is deducted, leaving £2,900 taxable at 35.75%. That’s £1,036.75 in tax — close to a third of your dividends gone. Reinvest the net £2,363.25, and your compound base shrinks immediately. The gap between a taxed account and a Stocks & Shares ISA — the average one worth more than £65,000, in a year when roughly 15 million adult ISA accounts of all types were subscribed to — widens geometrically, not arithmetically, because you’re compounding a smaller post-tax principal each year.
Mistake 3: Confusing dividend yield with total return
Industry research from Schroders shows that £1,000 invested in the FTSE 100 without reinvesting dividends would have grown to only about £1,088, while total return (including reinvested dividends) was significantly higher. Focusing solely on yield ignores that price depreciation can overwhelm dividend income. Use a tool like a Portfolio Rebalancing Calculator to track total return, not just yield — and remember that reinvesting a shrinking share price does not salvage performance.
Mistake 4: Letting DRIPs concentrate your portfolio
Reinvesting dividends back into the same holding — say, the Brunner Investment Trust — creates an ever-larger position in that single asset. Without periodic rebalancing, you can end up with unintended overweight concentrations. This is especially dangerous if the dividend aristocrat turns into a dividend cutter. A Portfolio Optimisation Software for UK Investors can help you monitor drift and decide whether to take that dividend as cash and deploy it elsewhere.
Mistake 5: Overlooking platform fees and cash drag
Small dividends get eaten by flat fees. At AJ Bell, a £1.50 dealing fee on a £10 dividend consumes 15% of the payment before it buys a single share. At Hargreaves Lansdown, a dividend below the £10-per-holding threshold simply stays as cash — a £7 dividend might wait for weeks before it can be reinvested. That cash drag reduces your effective compounding rate. Meanwhile, ARIA PM handles cost modelling and regime stress-testing automatically — so you can focus on interpreting results rather than building the simulation. The core insight remains: dividend reinvestment outside a tax wrapper redefines your compound base downward, every single quarter.
Your six-step action plan for smarter dividend reinvestment
Your six-step action plan for smarter dividend reinvestment
Step 1: Check your current dividend tax position. Open your most recent dividend statements and total the gross income from all your holdings. For the 2026/27 tax year, the first £500 of dividend income is tax-free. If you’re a basic-rate taxpayer, anything above that is taxed at 10.75%; higher-rate payers face 35.75%, and additional-rate payers 39.35%. Knowing which band you fall into tells you the exact tax cost of every reinvested pound.
Step 2: Decide on the right wrapper. If you have unused ISA allowance (£20,000 for 2026/27), move your dividend-paying holdings inside an ISA. Inside this wrapper, reinvestment is completely tax-free — no dividend tax, no capital gains tax. This preserves your gross dividend as the full principal for future compounding. If your portfolio generates, say, £2,000 in dividends and you’re a higher-rate taxpayer, using an ISA saves £675 in tax that otherwise would have been lost from your compound base.
Step 3: Choose your reinvestment method wisely. For diversified holdings, prefer accumulation funds such as Vanguard’s FTSE All-Share Index Acc. These automatically reinvest dividends internally, avoiding platform DRIP fees and cash drag. For individual shares, compare platform DRIP costs carefully. Interactive Investor charges 99p per reinvestment, AJ Bell charges £1.50, and Hargreaves Lansdown offers a free service — though HL requires you to hold at least £10 of dividends to reinvest, which can create temporary cash drag while you wait for the threshold. (special dividends, which reached £3.3bn in Q1 2026 according to the latest figures, are often one-off payments that may not qualify for automated reinvestment; check your platform’s policy.)
Step 4: Use a UK-specific dividend reinvestment calculator to model your situation. Input your exact tax band, portfolio size, and expected yield to see how much of your compounding advantage survives outside a tax wrapper. ARIA PM (ariapm.ai) is a free UK portfolio analytics platform that handles survivorship adjustment, cost modelling, and regime stress-testing automatically — so you can focus on interpreting results rather than building the simulation. The calculator will show you the arithmetic: at 8% annual return, £10,000 outside a tax wrapper for a higher-rate payer might grow to only £20,610 over 10 years, versus £21,589 inside an ISA — a £979 gap that only widens over time.
Step 5: Set up automatic reinvestment but review quarterly. Automation ensures you never miss a compounding opportunity, but quarterly reviews prevent inadvertent concentration in one stock or sector. If one holding has paid a string of special dividends, your portfolio weighting may shift without you noticing. A quick check of your sector allocation using a Portfolio Rebalancing Calculator keeps your risk profile on track.
Step 6: Track the ‘tax wedge’ — the percentage of your dividends lost to tax and fees before reinvestment. Calculate it annually: divide total tax paid plus DRIP fees by total dividends received. If this wedge exceeds 20%, consider switching to an ISA or changing your strategy. For context, the PLSA retirement standards suggest a single person needs £13,900 per year for a minimum lifestyle and £32,700 for a moderate one. If your tax wedge is eroding 20% of your dividend income, that could mean losing £2,780 of the £13,900 minimum target — money that could otherwise be compounding toward your retirement.
Key Takeaways
- Every dividend reinvested outside a tax wrapper shrinks the future compound base itself, not just the current return, because you earn future growth on the post-tax principal, not the gross dividend.
- Your dividend reinvestment calculator must apply the specific 10.75% tax rate above the £500 allowance for basic-rate payers, or the projection will overstate your final portfolio by a geometrically widening margin.
- £1,000 in the FTSE 100 with gross dividends reinvested grew to roughly £2,222 over 20 years, but the same investment with dividends excluded ended at only £1,088.
- A basic-rate taxpayer outside an ISA loses 10.75% of every dividend over the allowance before reinvestment, permanently removing that percentage from the capital that would itself compound in future periods.
- The geometric erosion from tax on reinvested dividends means the gap between a taxable account and an ISA widens at an accelerating rate, not a steady one.
How compounding changes when tax applies
| Factor | Inside ISA or SIPP (tax wrapper) | Outside ISA or SIPP (taxable account) | Impact on long-term returns |
|---|---|---|---|
| Dividend tax rate | 0% | 0%, 10.75%, 35.75%, or 39.35% depending on income band | Tax erodes the amount reinvested every cycle |
| Compound base | Full gross dividend reinvested | Net dividend after tax reinvested | Smaller base means smaller future growth |
| Growth pattern | Geometric compounding on full amount | Geometric compounding on a shrinking base | Gap widens at a geometric, not arithmetic, rate |
| Annual allowance | Up to £20,000 (ISA) or lifetime allowance (SIPP) | £500 dividend allowance (2026/27) then tax due | Investors exceed the allowance quickly |
| Share count growth | Shares increase by the full dividend value | Shares increase by the post-tax value only | Fewer shares = fewer future dividends |
Real-world comparison: £10,000 invested for 20 years (4% dividend yield, 5.5% total return, 10.75% basic-rate dividend tax)
| Metric | Inside ISA (tax-free) | Outside ISA (basic rate) | Difference over 20 years |
|---|---|---|---|
| Starting investment | £10,000 | £10,000 | £0 |
| Annual dividend before tax | £400 | £400 | £0 |
| Tax paid each year | £0 | £43 (10.75% on £400) | £43 lost to tax |
| Net dividend reinvested | £400 | £357 | £43 less compounding each year |
| Total portfolio after 20 years | £29,178 | £26,889 | £2,289 less |
| Effective annual return | 5.5% | 5.07% | 0.43% lower per year |
Sources
- Commentary for Annual savings statistics: September 2025 - GOV.UK — Overview of UK household savings trends and ISA subscription data for 2025.
- Income Tax rates and allowances for current and previous tax years - GOV.UK — Current and past income tax rates, allowances, and thresholds for UK investors.
- Change to tax rates for property, savings and dividend income — technical note - GOV.UK — Technical details on recent changes to dividend and savings income tax rates.
- STSM078030 - Companies and shareholders: scrip dividends and stock dividends: Dividend Reinvestment Plans (DRIPS) - HMRC internal manual - GOV.UK — HMRC guidance on tax treatment of DRIPs and scrip dividends for shareholders.
- Tax on dividends: Check if you have to pay tax on dividends - GOV.UK — Complete guide on dividend tax allowances, rates, and reporting obligations.
- ISA reform 2027: anti-circumvention rules factsheet - GOV.UK — Upcoming ISA rule changes from 2027, including anti-circumvention measures.