

Picture this: you’re 45, with £50,000 saved in a SIPP, and an online Dividend Growth Calculator promises your income will swell from £1,750 a year now to over £10,000 in two decades. That projection can shape your retirement plan. One wrong assumption about future growth, and you might undershoot your actual income by thousands. This article shows you why the calculator’s real power is not in forecasting that future figure, but in revealing how fragile the promise is when growth stalls. You do not need a finance degree to use it. You need to understand the one assumption that makes or breaks your entire projection. That single insight will save you from betting your retirement on an illusion.
What is a dividend growth calculator — and why it matters for your retirement income
You sit down at your laptop, type a few numbers into a free online dividend growth calculator — your starting portfolio, a plausible yield, a growth rate — and it paints a seemingly magical picture. Twenty years from now, you are looking at £X in annual dividend income. The number feels concrete, almost bankable. But is it?
A dividend growth calculator is a straightforward tool. It projects your future annual dividend income from an initial investment, using three levers: your starting yield, your chosen dividend growth rate, and whether you reinvest or take the cash. You tweak the growth assumption, and the future income line bends higher or lower. It feels like looking into a crystal ball.
Here is the uncomfortable truth: that crystal ball is a compounding illusion. The single most important input — the dividend growth rate — is both unknowable and path-dependent. The calculator’s 20-year income stream is dominated by that assumed rate, yet you have no way to know what it will actually be. Consider what real UK dividend data shows. Industry research for full-year 2025 recorded total UK headline dividends of £87.5bn, but the year-on-year headline change was -0.9% . Dig deeper, and the picture fractures further. Underlying dividend growth — the sustainable, recurring trend — was 3.6% in 2025 and 7.4% in Q2 2026. But that aggregate number masks reality: the median company increased its payout by only 2.8% in that same quarter, and just 11 of 20 sectors grew dividends at all. The headline number was inflated by one-off special payments and currency effects.
So when a projection shows you earning, say, a comfortable annual income in dividends two decades from now, ask yourself: what happens if the growth rate is just 1% lower than assumed? The projection collapses by thousands of pounds. The real value of a dividend growth calculator is not forecasting your future income. It is stress-testing how fragile that assumption is. Change the growth rate by even a single percentage point, and the illusion shatters.
If you want to understand how inflation erodes the purchasing power of that projected income, pair the calculator with an Inflation Calculator. To see how volatility in growth assumptions affects your confidence range, use a Volatility Calculator. And to stress-test whether the starting valuation matters, explore a Dividend Discount Model Calculator. Each tool reveals a different dimension of the same vulnerability. The growth rate is not a fact. It is a guess — and the calculator’s job is to show you how much the answer depends on it.
How a dividend growth calculator actually works: from starting yield to compounding assumptions
Let’s look inside a dividend growth calculator. It asks you for three things: the amount you have invested (or the annual dividend income you already receive), a starting yield, and a growth rate you expect dividend payments to increase by each year.
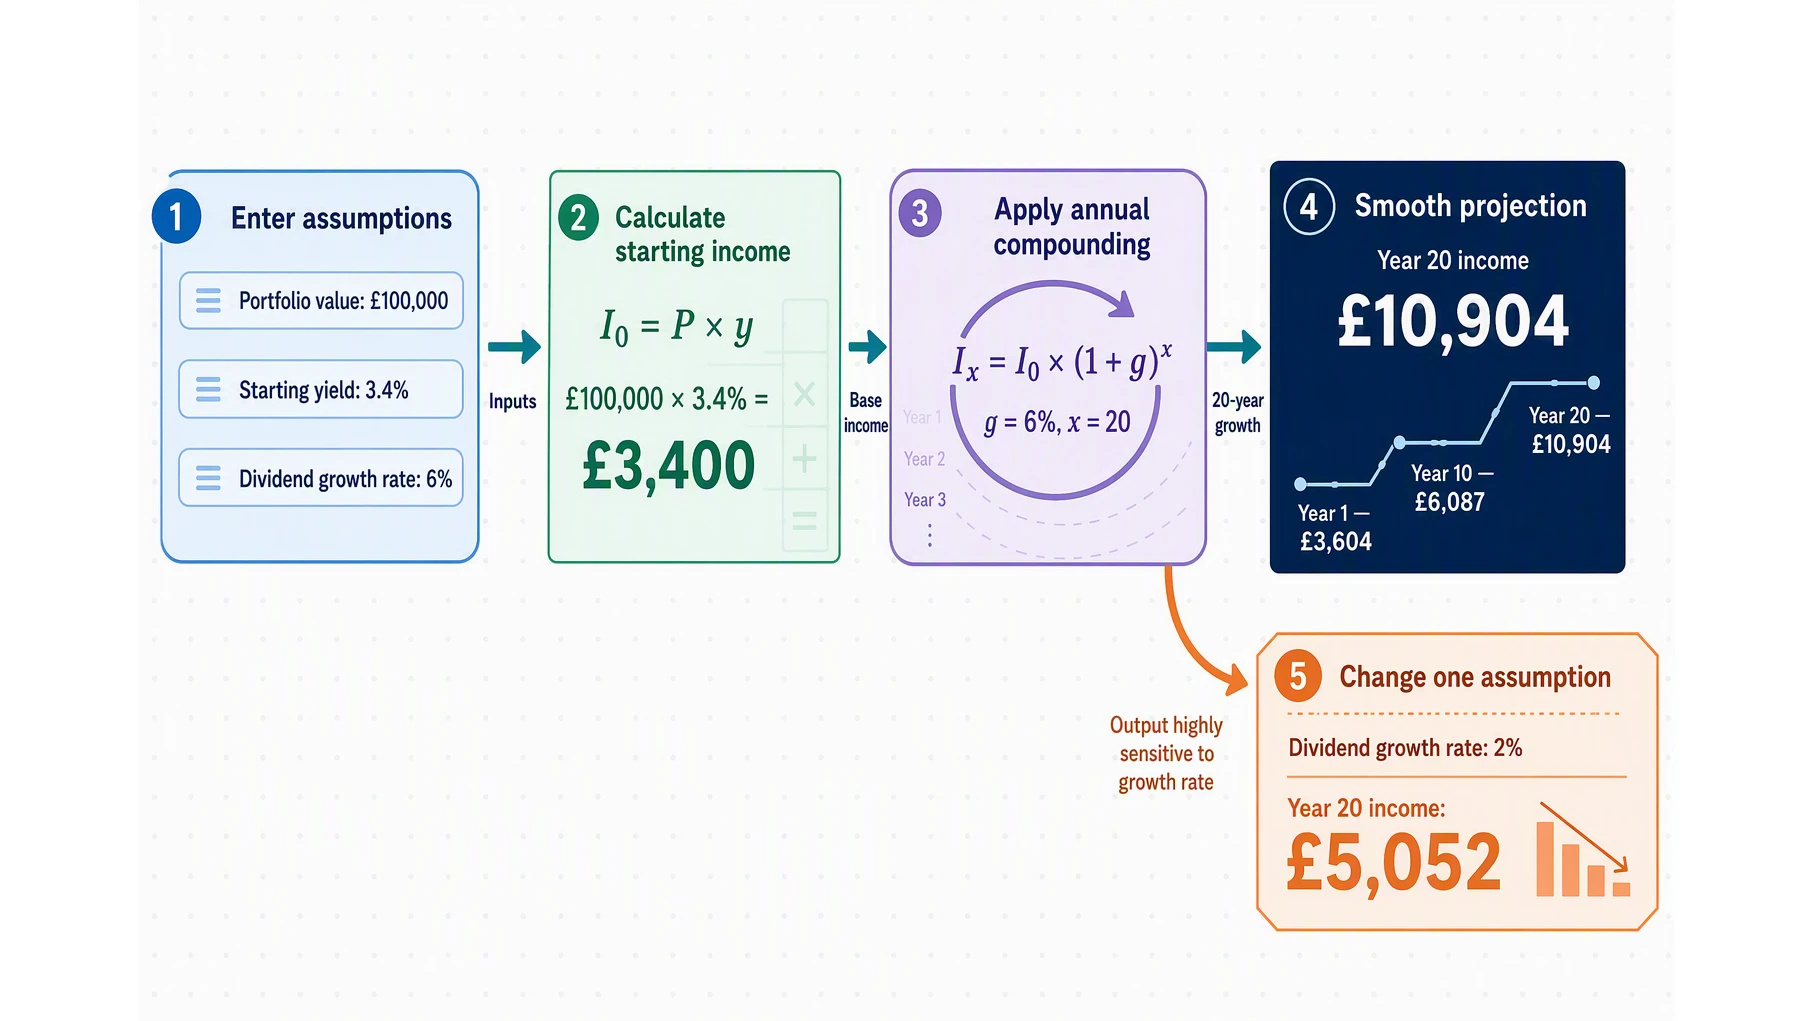
Take a concrete example. Imagine you have £100,000 invested. If the UK Equity Yield on your portfolio is 3.4% (close to the FTSE 100’s forward yield in 2026), your starting annual income is £3,400. The calculator then applies a simple compounding formula: Year X dividend = Starting dividend × (1 + assumed growth rate)^X. If you tell the tool you expect 6% annual dividend growth, it projects your Year 20 income at £10,904. That is a compelling number.
But the critical insight is this: the growth rate is an assumption, not a fact. The calculator’s output is a compounding illusion — it is dominated entirely by the rate you typed in. If growth turns out to be 2% (which is nearer the median experience of FTSE 100 companies), your Year 20 income is just £5,052. That is less than half the original projection. The same starting conditions, the same 20 years — and a difference of nearly £6,000 in annual income, purely because the assumed growth rate was wrong.
Real-world complications make this worse. The calculator ignores dividend cuts entirely. It does not factor in special dividends — those one-off payments that can inflate a year’s total (full-year 2025 UK dividends included £2.9bn in specials), only to vanish the next year. It ignores sector concentration: the FTSE 100’s record £88.8bn dividend forecast for 2026 sounds impressive, but in Q2 2026 just five companies paid 41% of all UK dividends. Banks like HSBC, NatWest, and Standard Chartered grew dividends 25-75% in Q2 2026 — rates that are clearly unsustainable. The tool also skips inflation (use our Inflation Calculator to see how buying power erodes) and the impact of tax (a higher-rate payer faces 35.75% on dividends outside an ISA).
The real value of a dividend growth calculator is not in forecasting your future income. It is in stress-testing how fragile that assumption is. Change the growth rate from 6% to 2%, and your entire retirement plan shifts. Change it to zero (a dividend freeze) or negative (a cut), and the picture changes again. Tools like ARIA PM handle these regime stress-tests automatically — so you can focus on understanding what happens when reality diverges from your optimistic assumption, rather than building the simulation yourself. For a deeper look at how dividend assumptions link to valuation, explore the Dividend Discount Model Calculator.
Dividend growth in practice: real UK funds, trusts, and platforms that show the strategy at work
Arriving at a 20‑year projection from a dividend growth calculator feels reassuringly precise — but the real world is messier. The single best illustration is the City of London Investment Trust (CTY). In 2026 it increased its dividend for the 60th consecutive year, a 4.0% rise to 22.15p. That record is so steady it has become a benchmark for UK income investors, yet even here the path was rarely straight. The trust’s structural advantage — its ability to retain a portion of revenue in strong years and release it during downturns — is something no simple projection can model. A calculator assumes smooth annual increases; an investment trust manager actually smooths them.
Consider the arithmetic of yield versus growth. A 2% yielder growing its dividend at 10% may still be less attractive than a 4% yielder growing at 5%, depending on valuation, risk, and reinvestment opportunities — and a dividend growth calculator cannot tell you which company will sustain its trajectory. Real examples help. The Royal London UK Dividend Growth Fund returned 46.77% over five years to August 2026, against 32.58% for its sector. JPMorgan Claverhouse (JCH) raised its dividend 68.4% over ten years. Both are historical outcomes, not guarantees, but they show that disciplined growth can outperform a static high yield — especially when that high yield gets cut.
There is also the role of share buybacks as a complement to dividends, forming a company’s total cash return. A firm that returns cash through both channels may reward shareholders even while its dividend growth appears modest. The WisdomTree UK Quality Dividend Growth ETF (UGRW), which charges 0.29% and distributes quarterly, tilts toward companies with sustainable payout policies — but screening for those names is itself a challenge. Platforms such as Interactive Investor and AJ Bell offer dividend‑growth screeners and portfolio tools to help, though the screening is only as good as the data behind it.
All this reinforces why the dividend growth rate in a calculator is a fragile assumption. Industry research showed UK dividends grew only 1.3% headline — 2.1% underlying — in Q4 2025. That is a long way from the 7%-10% many projections use. For a fuller perspective, ARIA PM handles survivorship adjustment, cost modelling, and regime stress‑testing automatically — so you can focus on interpreting results rather than building the simulation. Tools like the Inflation Calculator or Volatility Calculator further reveal how today’s assumptions compound into tomorrow’s surprises. And when comparing your dividend growth expectations against capital gains, the Dividend Discount Model Calculator helps separate price from income — a distinction too many long‑range forecasts blur.
The key inputs that make or break your dividend income projection
The four inputs that make or break your dividend income projection are not the ones you can copy from a screen. They are the assumptions you choose — and each one can shift your 20-year income by thousands of pounds. A stress-test on each reveals whether that comforting projection is a solid plan or a fragile hope.
The starting yield. The FTSE 100 forward dividend yield sits at approximately 3.4%, but buying a stock simply because it yields more can backfire. Dividends from the food, drink and tobacco sector fell 15.9% in Q2 2026, and Diageo halved its payout entirely. A headline yield of 6% looks attractive until the dividend is cut; the calculator assumes it persists and grows, which it may not. A dividend growth calculator cannot distinguish a sustainable 4% yield from a distressed 7% one — only your own research can.
The growth rate. This is the lever that dominates the outcome. An 8% annual dividend growth rate doubles your income every nine years, but real-world UK underlying growth has been 3-4% recently, with the median company-level dividend growth at just 2.8%. That gap matters: if you input 8% but reality delivers 3%, your projected £10,000 income in year twenty is actually closer to £4,000. Worse, growth is path-dependent — a recession in year five resets the base. Run multiple scenarios (2%, 4%, 6-8%) to see the range. Also consider mid-cap dividend growth, which hit 5.4% in 2025 and can outpace the large-cap index; concentration in a few heavy payers skews aggregate figures upward.
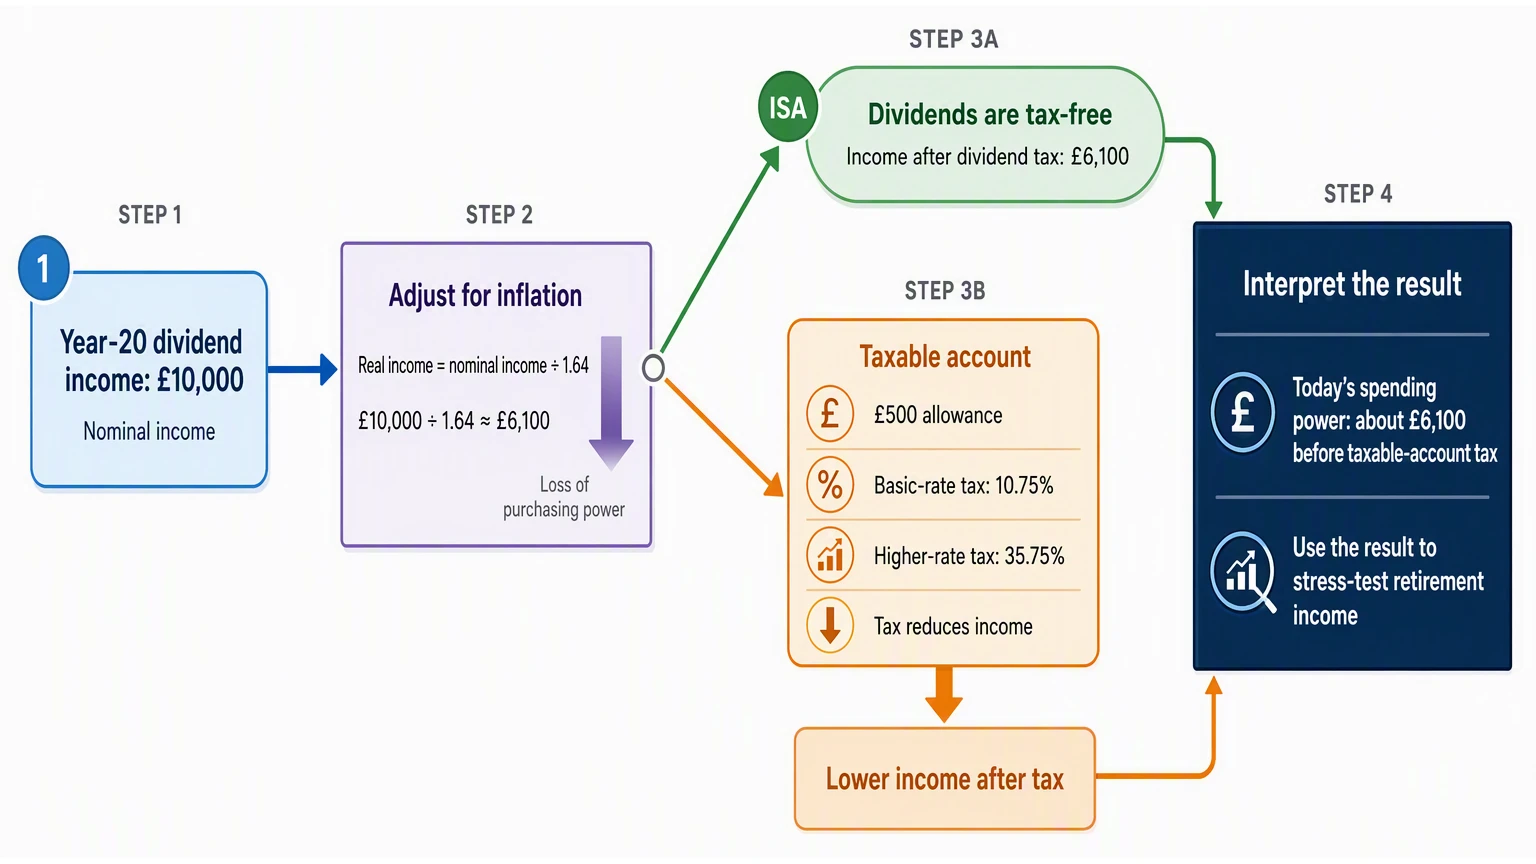
The tax wrapper. Inside a 2026/27 ISA, dividends are tax-free. Outside one, the £500 allowance means a £680 dividend from a £20,000 holding becomes partly taxable: 10.75% for a basic-rate payer, 35.75% for a higher-rate payer — a real drag that most calculators ignore entirely. A projection showing £10,000 gross income could be over £3,000 lighter after tax without the wrapper.
Inflation. A calculator showing nominal income of £10,000 in 20 years should also show its real value. At 2.5% inflation, that is only about £6,100 in today's spending power. Use an Inflation Calculator alongside your tool to see what those future pounds are worth.
Beware special dividends: Q2 2026 saw £465m paid out, down 76% year-on-year. They inflate headline yields but are not recurring, so exclude them from your input. A platform like ARIA PM adjusts for survivors, cost drag, and regime shifts automatically — letting you stress-test the fragile assumption rather than build the simulation yourself. Your Dividend Discount Model Calculator can also help value whether reinvested growth beats the cash yield. And just as Portfolio Rebalancing Software for UK ISA and SIPP Investors keeps asset mix aligned, revisiting these four inputs annually keeps your projection honest.
Five common mistakes investors make with dividend growth calculators — and how to avoid them
Let’s look at the five common mistakes investors make with a dividend growth calculator — and how to sidestep them.
Mistake 1: Using the market’s headline growth rate for your portfolio. Industry research shows that underlying UK dividend growth hit 7.4% in Q2 2026. That sounds encouraging — until you see the composition. Banks grew payouts by 20.6% and miners by 27.5%. If your portfolio doesn’t own those sectors, you might be projecting a growth rate that has nothing to do with your actual holdings. A dividend growth calculator lets you stress-test at, say, 2%, 4-6% and 8% — not just one optimistic number from the index.
Mistake 2: Confusing dividend growth with total return. A company can raise its dividend while its share price falls. Your total return is yield plus earnings growth plus valuation change — not just the dividend line. Use a Dividend Discount Model Calculator to see how a higher payout ratio might squeeze reinvestment. A dividend growth calculator is not a total-return tool.
Mistake 3: Ignoring dividend cuts and flat years. The calculator assumes smooth, geometric growth. Reality includes halts: Diageo halved its payout, and total payments from UK firms declined slightly in a recent quarter because special dividends fell — even though recurring dividends rose by 3.6%. A single bad year can reset your entire dividend income projection.
Mistake 4: Overvaluing ‘yield on cost’. That original $50 share now paying $4 is an 8% yield on cost — psychologically satisfying but irrelevant. Today’s share price is £100, so your opportunity yield is 4%. A Portfolio Health Check measures current yield, not historical comfort.
Mistake 5: Forgetting that dividend growth is concentrated. In Q2 2026, the top five payers — HSBC, Rio Tinto, NatWest, Unilever, Shell — accounted for 41% of all UK dividends. Many dividend growth calculator templates apply a uniform rate across your portfolio. That ignores concentration risk. ARIA PM handles survivorship adjustment and regime stress-testing automatically — so you can focus on interpreting results rather than building the simulation.
Remember the core lesson: the advertised 20-year income stream is dominated by the dividend growth rate you type in. That rate is unknowable and path-dependent. Use the calculator not as a prophecy, but as a fragility detector — to see how quickly a 1% growth shortfall or a single cut reshapes your future.
Your practical action plan: how to use a dividend growth calculator wisely starting today
Your practical action plan: how to use a dividend growth calculator wisely starting today
Step 1: Enter your actual numbers into a free UK dividend growth calculator.
Open a tool like aCalculator.co.uk or ARIA PM, which handles survivorship adjustment, cost modelling, and regime stress-testing automatically — so you can focus on interpreting results rather than building the simulation. Input your current portfolio value and your weighted average dividend yield. If you hold a mix of FTSE 100 stocks yielding 3.5% and mid-caps yielding 2.5%, calculate the blended yield. Be honest about your starting point; the calculator will do the rest.
Step 2: Run four scenarios — 2%, 4%, 6%, and 8% dividend growth — and record the year-10 and year-20 nominal income.
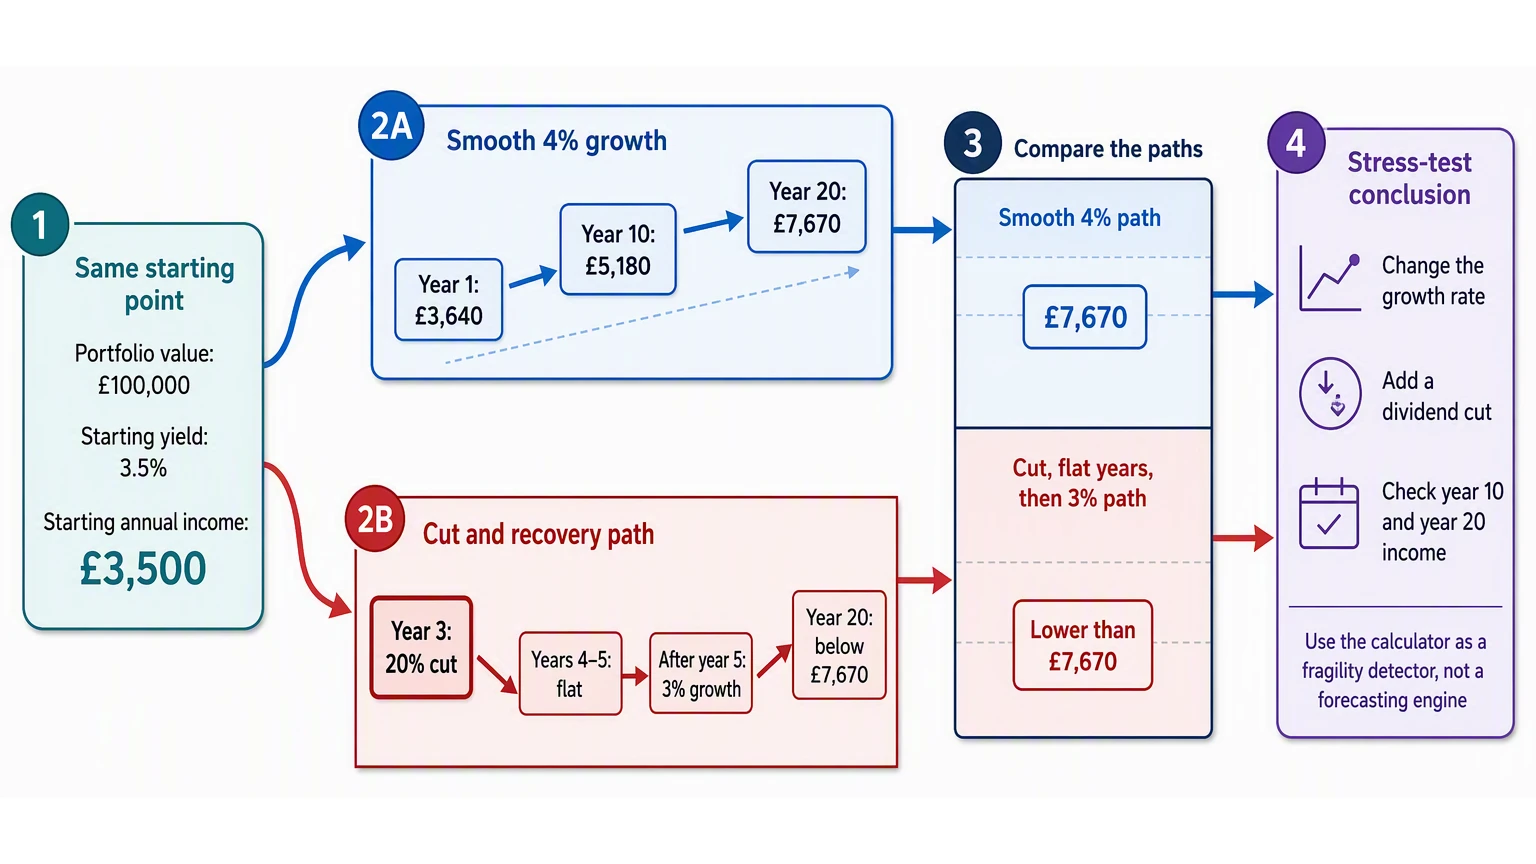
Write down each number. For a £100,000 portfolio yielding 3.5% (£3,500 starting income), at 4% growth you'd see roughly £5,180 in year 10 and £7,670 in year 20 — nominally. At 8% growth, those figures jump to about £7,560 and £16,310. The difference between 2% and 8% in year 20 is not a few hundred pounds; it is more than a factor of two. This is the compounding illusion in action: the calculator projects exponential returns from a rate you cannot know in advance.
Step 3: Adjust for inflation to see real spending power.
Divide your year-20 nominal figures by 1.64 (the approximate cumulative effect of 2.5% inflation over 20 years). That 8% scenario (£16,310 nominal) becomes roughly £9,945 in today's money. The 2% scenario (£5,200 nominal) shrinks to about £3,170. The PLSA 2026 moderate retirement standard is £32,700 for a single person — stress-test whether your dividend projection gets anywhere near that in real terms. If it doesn't, you know the gap you need to close through higher savings, lower withdrawals, or more realistic growth assumptions.
Step 4: Add a 'dividend cut' scenario — the reality check most projections skip.
Assume a 20% cut in year 3, then flat growth for two years, followed by 3% growth thereafter. Compare that path to the smooth 4% growth projection. The difference will be stark — and far more realistic. Industry data from Computershare showed that in 2025, the strongest underlying growth came from mid-cap companies at 5.4%, compared with about 3.4% for FTSE 100 companies. Aggregate UK dividends hit £35.3bn, but that headline number conceals concentrated dividend growth — a small number of large companies like banks drove the majority of increases, a pattern that can reverse suddenly.
If you hold these investments in a taxable account, subtract dividend tax on income above the £500 allowance: 10.75% for basic-rate taxpayers, 35.75% for higher-rate. For a higher-rate payer projecting £7,670 in year-20 income, that means roughly £2,560 in tax — eroding your purchasing power further. The goal of this exercise is not to find the 'right' number. It is to understand how sensitive your future income is to assumptions you cannot control — the dividend growth rate, the sector contribution of banks versus miners versus healthcare, and the tax regime.
Use an ISA or SIPP for all dividend-growth investments to avoid this tax erosion entirely. Your £20,000 annual ISA allowance lets every pound of growth and every dividend compound untouched. The calculator is a stress-testing tool, not a forecasting engine. Use it to ask 'what if', and be sceptical of any projection that assumes smooth sailing for two decades.
Key Takeaways
- A dividend growth calculator’s 20-year income projection is a compounding illusion, because its output is dominated by the dividend growth rate you assume — a rate you cannot know and that will change with real market conditions.
- Lower your assumed growth rate by just 1% in the tool, and watch the projected annual income drop by thousands of pounds; this stress test reveals how fragile your retirement plan actually is.
- Real UK data shows the sustainable underlying dividend growth rate sits around 3.6%, not the 7-8% often plugged into calculators — use that lower figure to get a sober, realistic baseline for your projections.
- Individual company payouts diverge sharply from the headline rate: in Q2 2026 the median UK company grew its dividend by only 2.8%, and just 11 of 20 sectors increased payouts at all.
- Rely on the calculator not to forecast your future income, but to test how quickly your assumptions break when faced with one-off special payments, currency distortions, and sector-specific stagnation.
| Factor | Dividend Growth Calculator Assumption | Real-World Reality | Impact on 20-Year Income |
|---|---|---|---|
| Growth rate | Fixed annual rate (e.g. 5% every year) | Variable; dividends rise, fall, or pause | £10,000s difference if rate drops by just 2% |
| Starting yield | Static yield from a single snapshot | Yield fluctuates with share price changes | Overstates income if bought at a market peak |
| Time period | Linear compounding over 20 years | Non-linear; recessions, cuts, and freezes occur | Path-dependent outcome, not a smooth curve |
| Portfolio composition | Assumes all holdings grow at same rate | Different funds grow at wildly different rates | One-size-fits-all projection is misleading |
| Dividend reinvestment | Assumes full reinvestment at constant yield | Tax, fees, and timing dilute reinvestment | Real total return is often lower than shown |
Key Mistakes When Using a Dividend Growth Calculator vs Practical Alternatives
| Mistake | What Investors Do | Why It Fails | Better Approach |
|---|---|---|---|
| Using market headline rate | Plug in the FTSE 100 average growth (e.g. 4%) | Your specific fund (e.g. City of London) may grow at 2-3% | Use the actual 5- or 10-year history of your chosen fund |
| Ignoring dividend cuts | Assume growth continues uninterrupted | 2008-2020, and 2022 saw widespread cuts | Stress-test with at least two zero-growth years |
| Forgetting inflation | Treat nominal income as real spending power | £10,000 in 20 years buys half as much | Subtract 2-3% annually for a real-terms projection |
| Overlooking platform fees | Ignore dealing costs and account charges | £100+ annual fees compound against you | Include a 0.5-1% annual drag on your starting pot |
| Relying on one calculator output | Take the final income figure at face value | No calculator can predict dividend policy changes | Run three scenarios: a base case, a growth case, and a cut case |
Sources
- Tax on dividends: Check if you have to pay tax on dividends - GOV.UK — Tax on dividends: eligibility, rates, allowances, and how to pay HMRC.
- Income Tax — Changes to Tax rates for Property, Savings and Dividend Income - GOV.UK — Income Tax: changes to dividend tax rates and allowances for savings.
- fca.org.uk — FCA policy statement on dividend-related financial rules and protections.
- UK Dividend Monitor Q4 2025 — UK Dividend Monitor Q4 2025: aggregate dividend trends and sector performance.
- UK Dividend Monitor Q2 2026 — UK Dividend Monitor Q2 2026: latest record high dividend data and key drivers.
- Computershare: Banks and miners lead the charge as UK dividends reach record high | Portfolio Adviser — Computershare: banks and miners driving UK dividends to a record high.