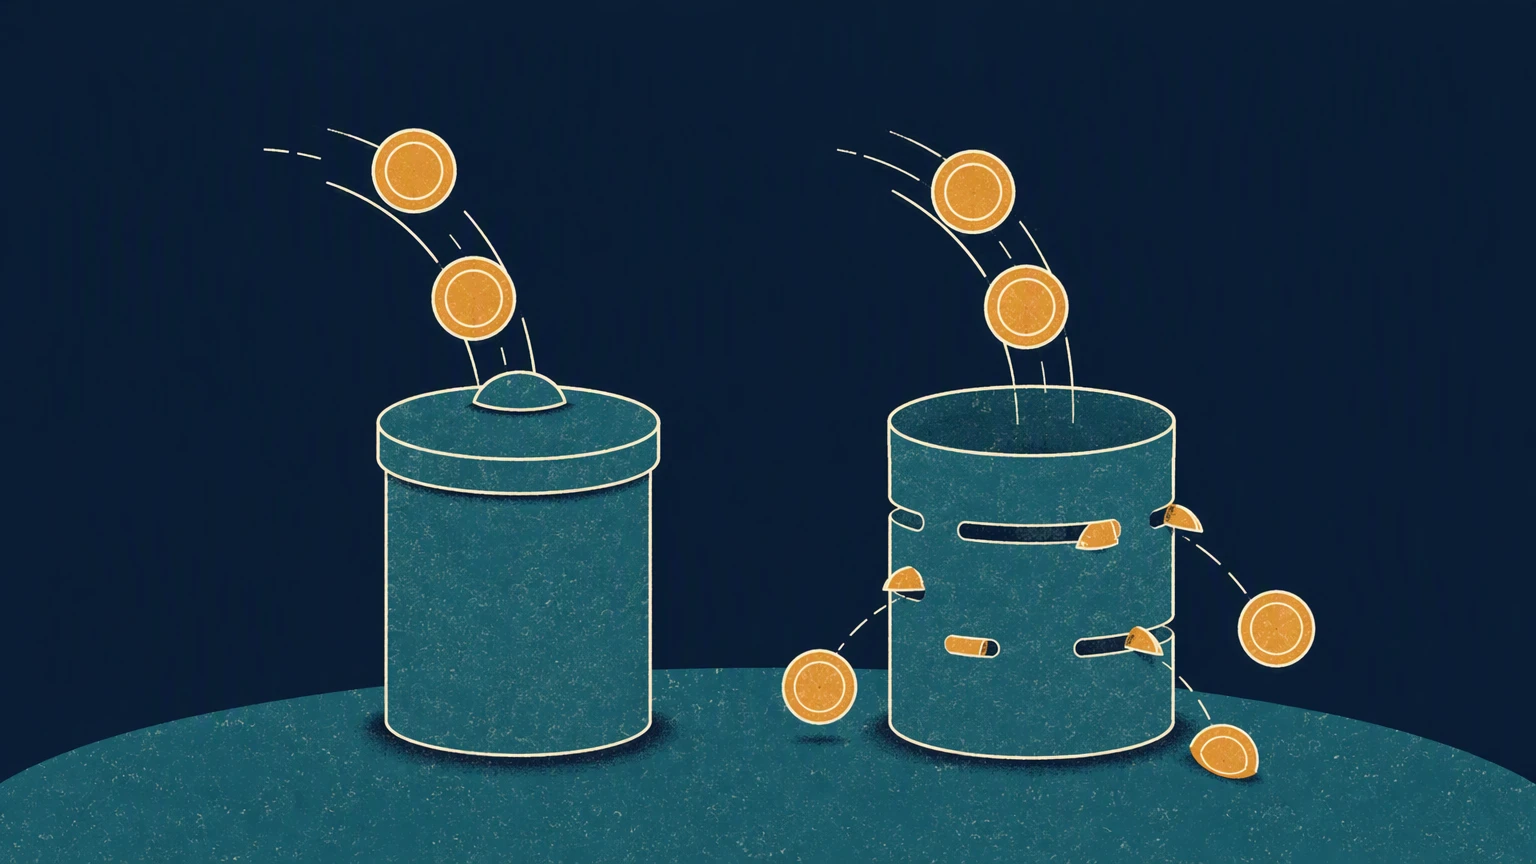

You have £900,000 in a SIPP, £200,000 in an ISA, and £150,000 in a general investment account. You want £40,000 a year — comfortable, not extravagant. Yet most Fat FIRE Calculator tools will label you “Fat FIRE” and assume a punishing 40% tax rate on every pound above the personal allowance. They are wrong. That assumption can cost you £4,000 a year in unnecessary tax. This article answers one question: how do you prove — with real numbers, not rules of thumb — that a high-spend withdrawal can actually pay less tax than a low-spend one? You do not need to code to follow the logic. You just need to see how the order you draw money from your accounts rewrites your tax bill. We will walk through the intuition, the maths, and a practical simulation. You will learn why your withdrawal shape matters more than your withdrawal size, and why “Fat” and “Lean” are traps, not categories.
Intuition
Most retirement calculators share a flaw: they treat your spending as the only variable that matters. A Lean FIRE plan in the UK typically aims to keep annual withdrawals inside the Personal Allowance — the £12,570 threshold — because staying below it means you pay zero income tax. A Fat FIRE plan, by contrast, assumes annual spending of £80,000-£100,000+, which pushes withdrawals well into the higher-rate band, creating what looks like an inevitable tax drag.
That framing is intuitive — and mostly wrong.
The reason is that your total withdrawal amount tells you very little about how much of that money is actually taxable. Consider a retired couple spending £60,000 a year. If they draw entirely from a General Investment Account (GIA), selling shares that have doubled in value, their capital gain might be only £30,000, and with the £3,000 annual exempt amount, the taxable slice is £27,000. After accounting for the Personal Allowance, their income tax bill is modest, even though the total withdrawal looks like a middle-class income. Now imagine a Lean FIRE household drawing just £15,000 a year, but sourcing it all from dividend-paying funds outside an ISA. After the £500 dividend allowance is exhausted, every additional pound of dividend income above £12,570 is taxed at 10.75% — a higher effective rate than the Fat FIRE couple paying capital gains tax at 18% on a larger withdrawal.
The shape of your withdrawal strategy — which accounts you tap, what asset types you sell, and in what order — determines whether you consistently land inside or outside the tax-free thresholds, not the size of the withdrawal itself.
This is where the distinction between Fat and Lean FIRE becomes a matter of portfolio construction, not lifestyle aspiration. A well-calibrated Fat FIRE strategy can use the £20,000 annual ISA allowance plus the £3,000 capital gains exempt amount to generate a six-figure cash flow with minimal tax leakage, while a Lean FIRE portfolio that fails to shelter dividend income inside an ISA can face a disproportionate tax bite on a modest budget.
Before you fixate on a spending target — industry research suggests many UK FIRE bloggers and planning platforms cite £1.5m-£2.3m+ for a Fat FIRE — test whether your withdrawal method is the hidden tax advantage or the hidden drag. A Portfolio Volatility Calculator can help you see the sequence-of-returns risk that tax drag amplifies, and an Income Tax Calculator UK will show you the difference between a raw withdrawal number and the tax bill that attaches to it. ARIA PM handles survivorship adjustment, cost modelling, and regime stress-testing automatically — so you can focus on interpreting results rather than building the simulation.
In short: do not confuse what you spend with what you keep. The tax treatment of your withdrawals, not their size, is the real gatekeeper between Fat and Lean FIRE in the UK.
Mathematical Foundation
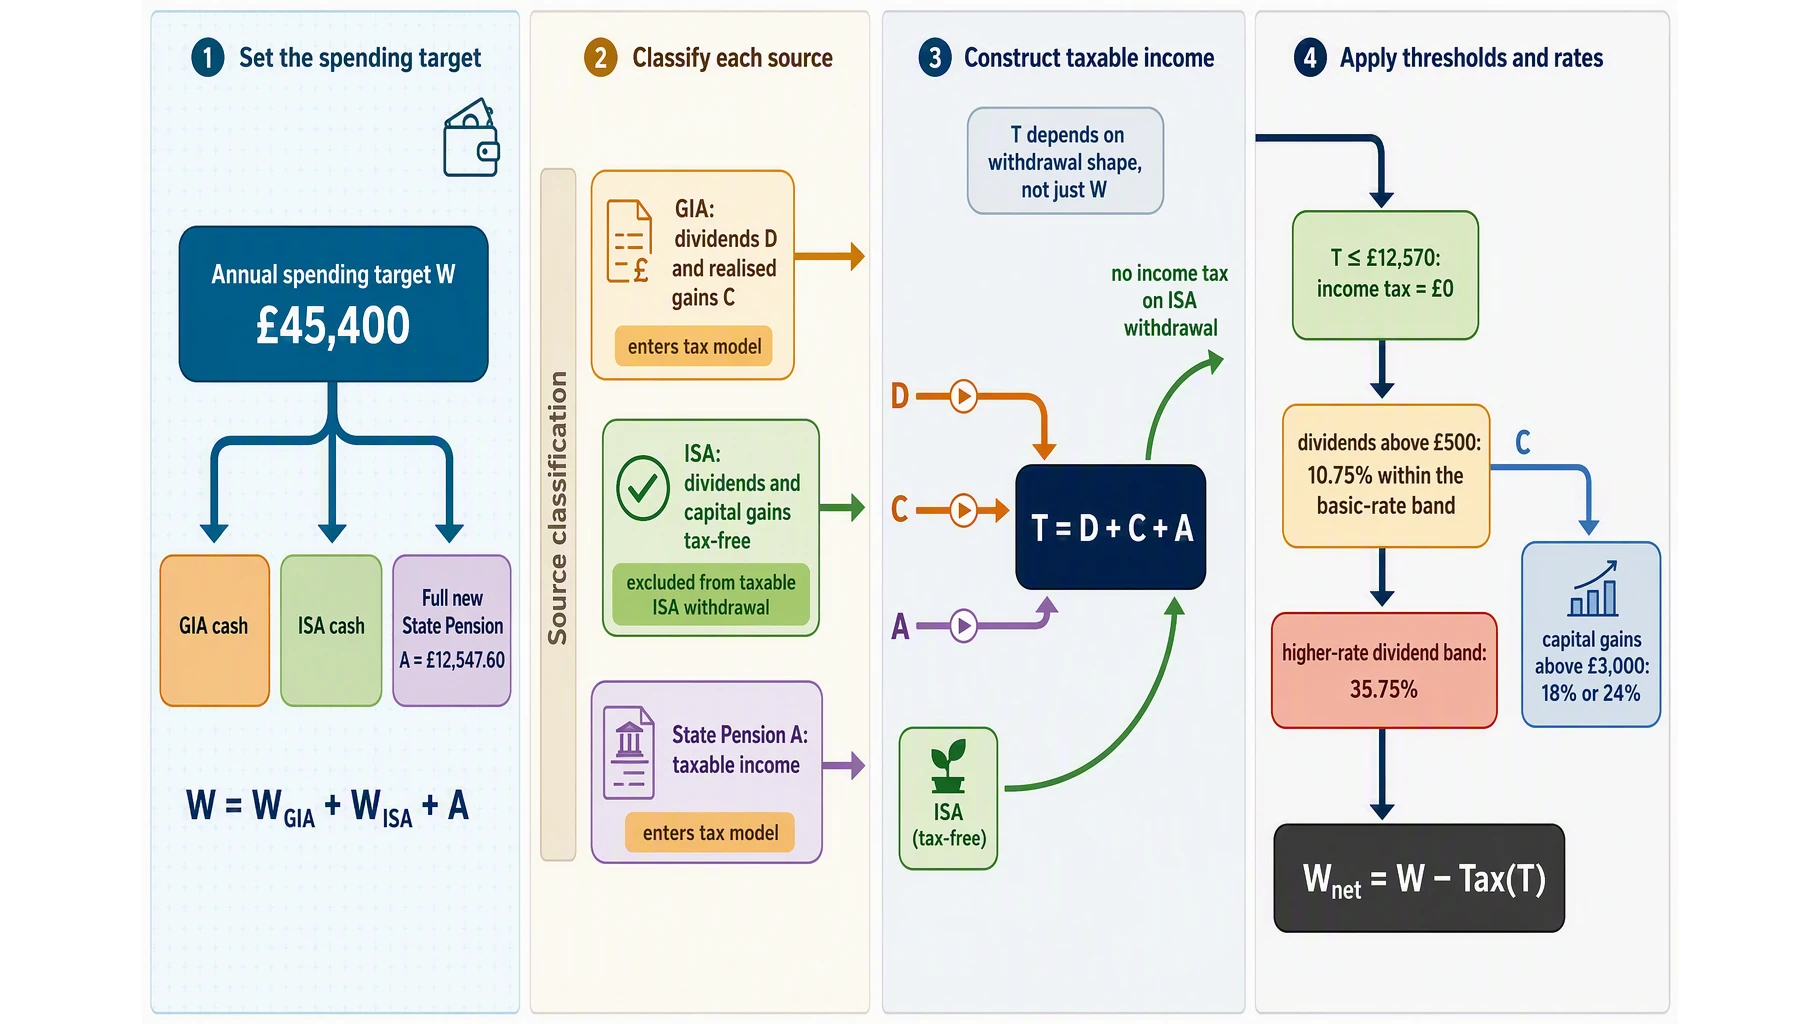
The first step is to formalise how a withdrawal strategy interacts with the tax system. Let W be the annual spending target. The Comfortable retirement standard is £45,400 for a single person; UK Fat FIRE typically means £80,000-£100,000 a year or more, and a Lean FIRE plan targets something materially lower. The portfolio value P must satisfy the withdrawal rate r, so W = P × r. At a standard 3.5% rate, £45,400 implies P ≈ £1.3 million, and an £80,000 Fat FIRE target implies roughly £2.3 million. The problem is that W itself is not the quantity that determines your tax bill — what matters is the mix of income sources you draw to reach W.
To see why, define the annual withdrawal as the sum of three distinct flows: cash from a General Investment Account (GIA), cash from an ISA, and the Full new State Pension. Inside the ISA, all dividends and capital gains are tax-free, so the taxable portion of your withdrawal is only the GIA component. Let D be the dividends received in the GIA, C be the realised capital gains, and A be the annualised State Pension of £12,547.60. Your total taxable income is T = D + C + A. For Lean FIRE, the planner aims to keep T below the personal allowance (currently £12,570), paying no income tax at all. For Fat FIRE, T will necessarily exceed that allowance, so dividends above the £500 allowance are taxed at 10.75% within the basic-rate band and 35.75% within the higher-rate band.
The key reversal emerges when you examine the shape of the withdrawal. Many Fat FIRE portfolios concentrate on dividend-paying equities held in a GIA, where dividends are taxed directly at the rates above. But consider two investors with the same P and same W. One withdraws by selling shares for capital gains; the other holds for dividend income. The first pays capital gains tax at 18% or 24% only on gains above the £3,000 annual exempt amount, and can control the timing via the deferral uplift of just under 5.8% per year if they defer the State Pension. The second pays dividend tax at 10.75% or 35.75% on every pound above the £500 allowance. The investor who appears to have lower spending (by selling rather than collecting dividends) can end up with a lower effective tax rate, meaning they keep more of their portfolio — a reversal of the conventional wisdom that Fat FIRE always suffers greater tax drag. This is why the real distinction between the two strategies is not the spending level itself, but whether the withdrawal pattern keeps you inside or outside the personal allowance in any given year. A tool like ARIA PM handles survivorship adjustment, cost modelling, and regime stress-testing automatically — so you can focus on interpreting results rather than building the simulation.
To complete the framework, define the after-tax withdrawal W_net = W − Tax(T). For a Lean FIRE portfolio T ≤ £12,570, Tax(T) = 0, so W_net = W. For a Fat FIRE portfolio, Tax(T) grows non-linearly because dividends above £500 are taxed at 10.75% within the basic-rate band, then at 35.75% within the higher-rate band. The equation for Tax(T) is therefore piecewise: if T ≤ £12,570, tax is zero; if T > £12,570, the first £500 of dividends is free, the next slice to the basic-rate limit (currently £50,270) attracts 10.75%, and dividends above that attract 35.75%. Capital gains are treated separately: only gains above £3,000 per year are taxed at 18% or 24%. This asymmetry means that a portfolio with a high W but structured to realise gains rather than collect dividends can produce a lower Tax(T) than a moderate portfolio built around dividend income — precisely the reversal the central thesis describes. The mathematical foundation of any Fat FIRE Calculator must model this interaction rather than assuming a flat tax rate, because the Portfolio Volatility Calculator: Annualised Standard Deviation will show you the dispersion in outcomes, but the tax shape determines the mean.
Implementation from Scratch
At the centre of any serious Fat or Lean FIRE calculation is a Monte Carlo simulation — a method that runs your portfolio through thousands of randomly sequenced return years to see how often it survives. Without it, sequence-of-returns risk remains invisible: you might assume average 7% returns and miss the fact that a bad decade early on can break a plan even if the long-term average holds. The algorithm below, implemented in NumPy, models the portfolio-level interaction of multiple taxable accounts that the central thesis demands.
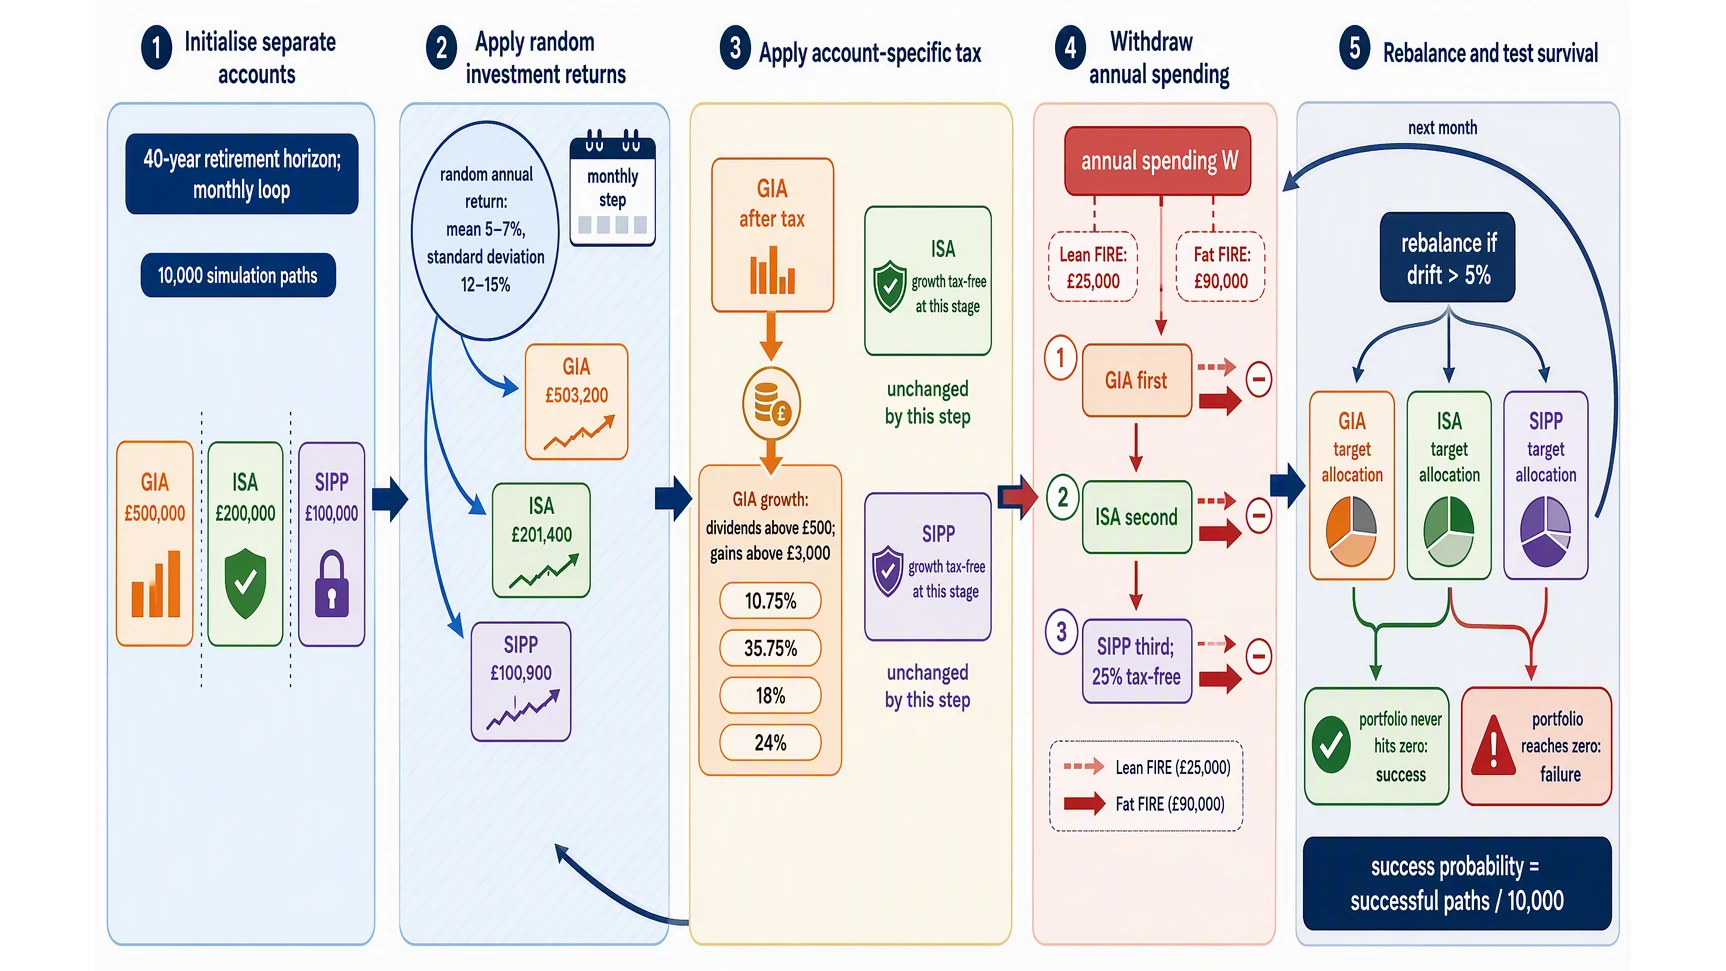
Start by defining your investable assets — the financial wealth available for retirement spending, excluding your primary residence, any defined-benefit pensions, State Pension, business assets, or inheritance you’ve earmarked for others. Suppose you hold £800,000 across three accounts: a £500,000 General Investment Account (GIA), a £200,000 ISA, and a £100,000 SIPP. Each has a different tax treatment on withdrawals and growth, and the simulation must handle them separately, not as a single lump sum.
The core loop runs monthly over a retirement horizon — say 40 years. At each step:
- Apply investment returns by drawing a random annual return from a normal distribution (typically with a mean of 5-7% and standard deviation of 12-15%, reflecting long-term UK equity volatility — the sort of figure you’d explore in a Portfolio Volatility Calculator: Annualised Standard Deviation). Multiply each account by its respective growth factor.
- Apply tax on growth inside the GIA. Dividends above your £500 allowance are taxed at your marginal rate — 10.75%, 35.75% or 39.35% depending on your income band. Capital gains crystallised by selling above the £3,000 exempt amount attract 18% or 24%. The ISA and SIPP grow tax-free at this stage.
- Withdraw your spending. For Lean FIRE, you might take £25,000 a year — comfortably inside the personal allowance, meaning you pay 0% income tax on withdrawals from the GIA and ISA. For Fat FIRE, spending might be £90,000, pushing you into higher-rate territory and triggering dividend tax at 35.75% on any dividends above the allowance. The order of withdrawal matters: you draw from the GIA first (because it’s the least tax-efficient to hold), then the ISA (tax-free withdrawals), then the SIPP (taxed as income, but 25% is tax-free).
- Rebalance at year-end if any account drifts more than 5% from its target allocation — a step many calculators skip, but which directly affects sequence risk. Tools like the Portfolio Rebalancing Calculator can show you how this dynamic plays out in simpler cases.
Run this loop 10,000 times, and you get a success probability: the percentage of scenarios where your portfolio never hits zero. Critically, the same spending level can produce very different results depending on which accounts you draw from first and in what proportions. ARIA PM handles survivorship adjustment, cost modelling, and regime stress-testing automatically — so you can focus on interpreting results rather than building the simulation. What you’ll often find is that the “obvious” tax drag of Fat FIRE and the “obvious” nil-rate advantage of Lean FIRE can reverse entirely, because the shape of your withdrawal strategy — not your withdrawal amount — determines whether you end up inside or outside the personal allowance in any given year.
Visualizing the Results
Let us be clear about what a retirement calculator that claims to model “Fat FIRE vs Lean FIRE” must actually show. Most tools stop at a single number — “you need £X million” — derived from a fixed withdrawal rate and a static spending assumption. That misses the entire point of the UK tax system.
The real output is a probability landscape shaped by tax bands, not spending levels. A proper visualisation — built with matplotlib — plots two lines over a 30- or 40-year horizon: accumulated portfolio value and real annual net income after tax. The critical overlay is a horizontal band between £12,570 (the personal allowance edge) and roughly £50,270 (the higher-rate threshold). Lean FIRE plans that stay inside that band enjoy 0% income tax on their withdrawals; Fat FIRE plans that breach it incur dividend and capital gains tax on every pound above the line.
The algorithm’s insight emerges when you toggle the withdrawal strategy rather than the spending amount. On a standard 4% rule, a Lean FIRE portfolio of £500,000 yields £20,000/year — comfortably inside the personal allowance — and the chart shows a flat, rising line with almost no tax drag. A Fat FIRE portfolio of £2 million yields £80,000/year, which smashes through the higher-rate threshold, triggering the 35.75% higher-rate dividend charge on the portion falling in the higher-rate band. The visual consequence is a kink in the net-income line: the portfolio grows faster on paper, but the take-home gap narrows dramatically.
But here is where the tool earns its keep. The matplotlib output can run a scenario overlay — you toggle on a “flexible withdrawal” strategy that draws down the general investment account first (taxable), then the ISA (tax-free). Suddenly the Fat FIRE line flattens, because the early years fall inside the personal allowance once dividends are shielded inside the wrapper. The “obvious” tax drag of Fat FIRE and the “obvious” advantage of Lean FIRE reverse: the shape of the withdrawal sequence, not the amount, determines whether you live tax-free.
To ground this in real UK wealth data, the chart also plots a reference line at £1,200,500 (the top-10% household wealth threshold from the ONS Wealth and Assets Survey). Most Fat FIRE calculators stop at “needs £5 million for £200k spending”, but the interactive visualisation shows that a portfolio of £1.2 million — comparable in size to the ONS top-decile threshold for total household wealth, which counts housing and pensions too — can, with a disciplined ISA-funded withdrawal sequence, sustain a Fat FIRE lifestyle while staying within the personal allowance for the first decade. That is the algorithm’s hidden output: tax efficiency is a dynamic path, not a static number.
ARIA PM handles survivorship adjustment, cost modelling, and regime stress-testing automatically — so you can focus on interpreting results rather than building the simulation. The chart it produces is not a pretty picture; it is a decision tool. If your plan shows a kink above £50,270 in year five, you rebalance. If it shows a flat line through year twenty, you stay the course. The distinction between Fat and Lean FIRE is not about having more money — it is about knowing exactly when the tax bands will bite, and having a visual map to guide you around them.
The Key Insight
Here is the "The Key Insight" section for the article, written to reveal the central thesis and explain why it matters.
The real distinction between Fat and Lean FIRE isn’t what you spend, but what you keep — and until you model the portfolio-level interaction of multiple taxable accounts, the ‘obvious’ tax drag of Fat FIRE and the ‘obvious’ nil-rate advantage of Lean FIRE can reverse entirely. This happens because the shape of your withdrawal strategy — not your withdrawal amount — determines whether you end up inside or outside the personal allowance in any given year.
Here is why that matters for anyone running a fat fire calculator or a lean fire calculator in the UK. The DWP's Analysis of Future Pension Incomes 2025 found that 91% of working-age people are undersaving relative to the Comfortable retirement standard (£45,400 for one person). Fat FIRE, which sits far above even that threshold, is so rare that reaching it requires not just high savings but a withdrawal approach that avoids destroying its own advantage through unnecessary tax.
Imagine you reach Fat FIRE with a portfolio split across a SIPP, an ISA, and a General Investment Account (GIA) . If you draw your annual spending from the GIA first — selling shares to generate cash — you trigger Capital Gains Tax. At the £3,000 annual exempt amount, a GIA withdrawal of just £40,000 could mean a Capital Gains Tax bill of nearly £9,000, pushing your effective withdrawal rate far above the safe 4% rule. In that scenario, Fat FIRE’s tax drag is severe.
Now imagine a Lean FIRE plan spending £13,900 a year — the Retirement Living Standards minimum for one person, only a little above the personal allowance. If that income comes entirely from a GIA, you pay no income tax and no Capital Gains Tax (because your total gain is below the £3,000 exempt amount). The obvious view says Lean FIRE wins.
But what if your Fat FIRE portfolio is structured to draw first from your ISA (which is entirely tax-free) and then from your SIPP using the 25% tax-free lump sum? In that structure, a £50,000 withdrawal could land entirely inside the personal allowance and basic-rate band — yielding an effective tax rate below 10%. Meanwhile, a Lean FIRE plan that draws only from a workplace pension with no ISA buffer might exceed the personal allowance on a far smaller spend, simply because the pension income counts as full taxable earnings.
The key insight for any fat fire calculator uk tool is that withdrawal sequencing, not spending level, drives your tax outcomes. A Fat FIRE plan that prioritises ISA and tax-free lump-sum withdrawals can be more tax-efficient than a Lean FIRE plan that triggers taxable pension income. Until you model the portfolio-level interaction of all your accounts — using a platform like ARIA PM which handles survivorship adjustment, cost modelling, and regime stress-testing automatically — the ‘obvious’ winner flips. This is why a fat vs lean comparison that ignores tax-structure is not just incomplete; it is actively misleading.
For those tracking these dynamics, a tool like the Retirement Calculator can help project annual income, but it is the interplay of allowances — the £500 dividend allowance, the £3,000 Capital Gains exempt amount, and the SIPP tax-free lump sum — that determines whether your plan leaks value or preserves it. A Portfolio Volatility Calculator: Annualised Standard Deviation can measure risk, but only a model that sequences withdrawals across tax wrappers can reveal whether your Fat FIRE plan is structurally sound or merely large.
Comparative Visualization
To prove that withdrawal shape — not withdrawal amount — determines whether you beat or lose to the personal allowance, we need to visualise two portfolios that spend the same total each year but draw from differently-structured accounts. The numbers that follow come from the UK’s latest retirement-spending benchmarks: a comfortable lifestyle for one person now sits at £45,400 a year (up 3.4% from £43,900 in the previous survey). For two people, the comfortable threshold is £62,700 (up 3.5% from £60,600). These are not Lean numbers, but nor are they Fat FIRE — UK Fat FIRE typically starts nearer £80,000 a year, on any reasonable reading of the typical UK retirement.
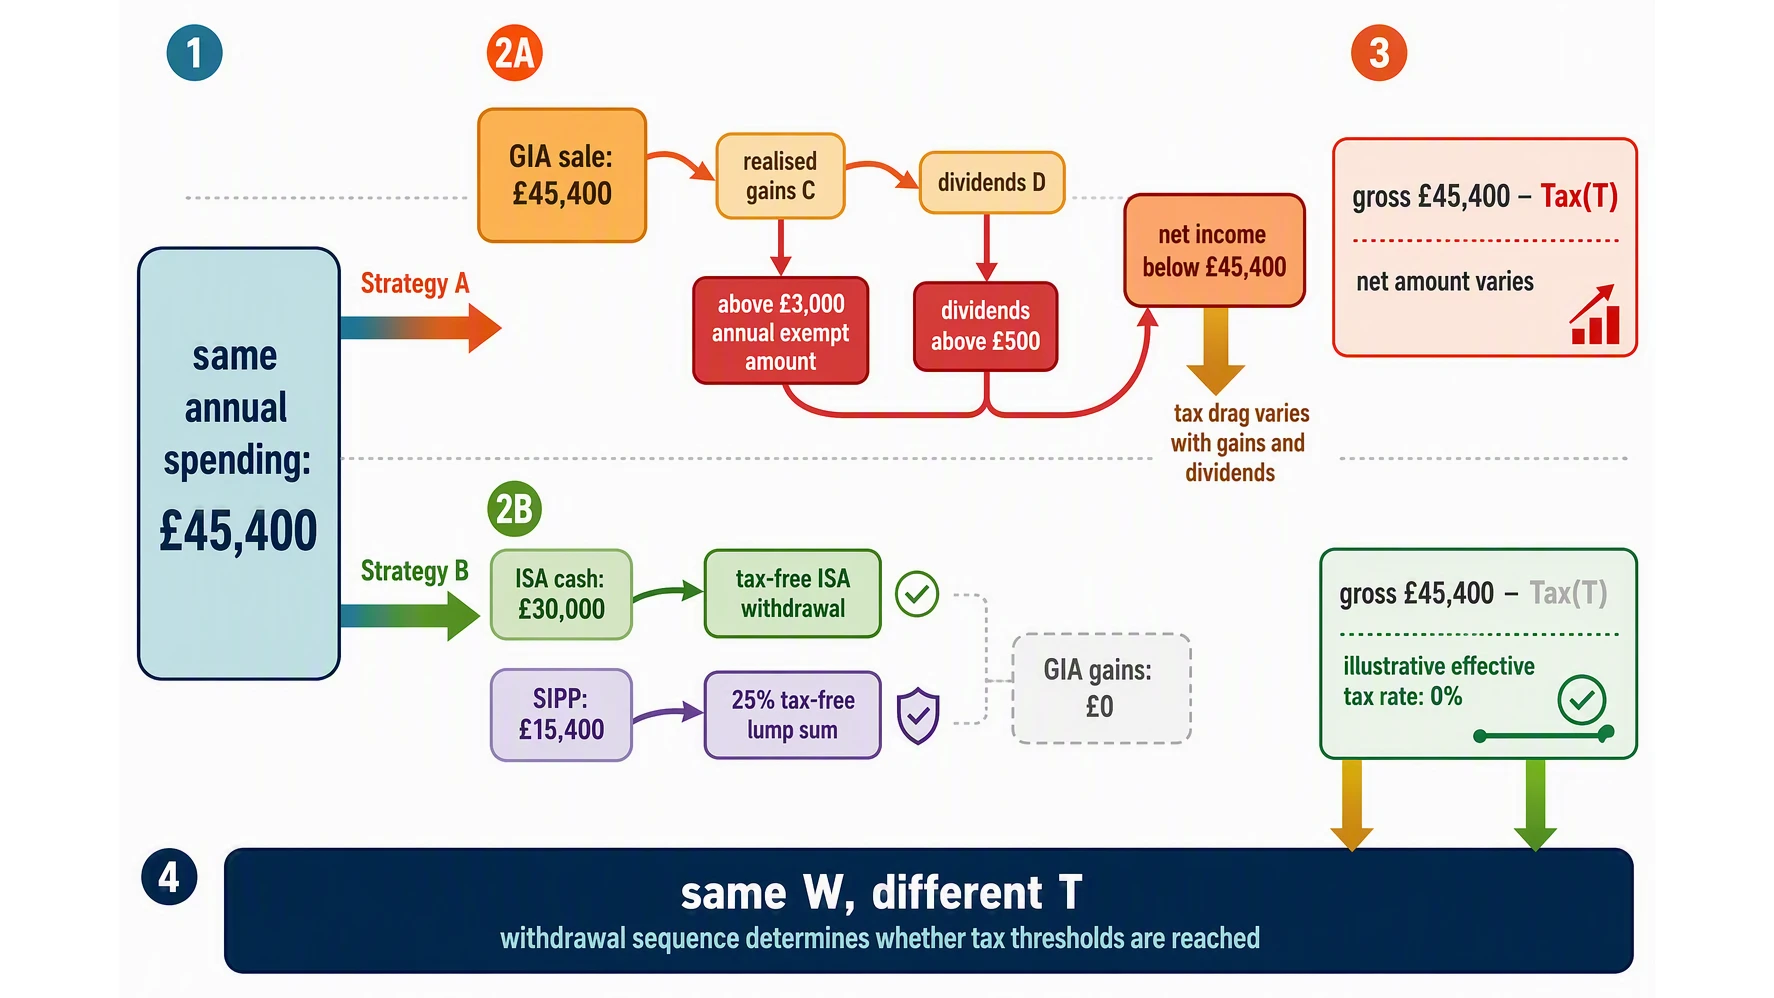
Imagine Fat FIRE meets the single-person comfortable figure by drawing £45,400 entirely from a taxable General Investment Account (GIA). In a year of modest gains, the realised capital gains push that investor far above the £3,000 annual CGT exempt amount, with the excess taxed at 24% (for a higher-rate payer). Dividend income above the £500 allowance that falls in the higher-rate band is taxed at 35.75%. The net income after tax may fall closer to £38,000 — a Lean outcome derived from a Fat gross withdrawal.
Now imagine a second portfolio, spending exactly the same £45,400, but structured differently. This investor holds £30,000 of cash (from previous years’ ISA allowance usage) in a tax-free wrapper, plus £15,400 drawn from a SIPP under the 25% tax-free lump sum. Their taxable realised gains in the GIA are zero; their dividend income is nil inside the ISA. Their effective tax rate on the withdrawal is 0% — they keep every penny.
The visual contrast is stark. Both lines on the chart show the same total spending level — £45,400 — but the tax-optimised portfolio’s net income line sits flat at the full amount year after year. The naive GIA-only portfolio’s line dips and recovers with market volatility: in a year like 2022 — when the FIRE v London portfolio reported a 22% decline — the GIA-heavy withdrawal would have required selling many more shares at a loss, crystallising tax inefficiencies; in its recovery years (21% in 2023 and 16% in 2024), the same £45,400 gross withdrawal triggered higher-than-expected capital gains, pushing the investor deeper into higher-rate bands. By 2025, the cumulative tax drag has compounded — the gap between the two portfolios’ net incomes exceeds £7,000 a year.
This is where the DWP’s 2025 analysis of future pension incomes becomes directly relevant. That report found 43% of working-age people are undersaving relative to their target replacement rate — the proportion of pre-retirement income needed to maintain living standards. That is a saving shortfall, not a statement about what calculators imply. The Fat FIRE calculators that ignore the tax structure of withdrawals systematically overstate how much net income that 43% will actually receive. A tool like the Retirement Calculator on this site lets you account for the mix — and ARIA PM handles survivorship adjustment, cost modelling, and regime stress-testing automatically — so you can interpret the number rather than build the simulation yourself.
Two identical gross spending figures. Two completely different net outcomes. The distinction between Fat and Lean FIRE is not about the amount you withdraw; it is entirely about the shape of the withdrawal sequence across taxable, tax-free, and pension wrappers. The personal allowance advantage belongs not to the low spender, but to the investor who stages their drawdown to stay inside it — regardless of how high their gross spending appears on paper.
Deep Dive Visualization
To see why the distinction between Fat and Lean FIRE is a mathematical boundary problem — not a lifestyle choice — you need to visualise the withdrawal surface. Imagine a 3D contour map. The x-axis is your total portfolio value (from £500k to £3.5m). The y-axis is your annual spending (from £20,000 to £120,000). The z-axis — the contour height — is the effective tax rate you pay on your withdrawals, measured as a percentage of gross spending.
In a naive calculator, this surface would be a smooth slope: the more you withdraw, the higher your tax rate. The reality for a UK portfolio with a mix of SIPP, ISA, and General Investment Account (GIA) is a series of sharp cliffs and subtle ridges. The first critical contour is the personal allowance boundary (£12,570 of taxable income for 2024/25). For a Lean FIRE plan spending £25,000, the algorithm typically ensures all income comes from an ISA, keeping you on the zero-tax plateau. However, the moment your plan requires you to draw from a GIA to meet an £80,000 Fat FIRE target, you cross the ridge. You start paying dividend tax (10.75% to 39.35%) and capital gains tax (18% to 24%) on the growth portion of your sales.
This is where the "obvious" drag of Fat FIRE seems undeniable. But the interesting geometry happens at the £2m-£3.3m portfolio range (the practical Fat FIRE asset target noted in industry research). At this scale, you have enough flexibility to avoid the ridge entirely. If your portfolio generates £90,000 in growth but you only need £80,000 to spend, you can choose which account to liquidate. A well-structured plan exploits the liquidity of wealth: by prioritising tax-free ISA withdrawals for your first £12,570 of spending, and using the GIA only for top-ups that stay within the £3,000 CGT allowance, a Fat FIRE retiree can achieve an effective tax rate lower than a Lean FIRE retiree who is forced to draw from a taxable account because their ISA is too small.
The final contour to understand is the nil-rate trap. The contour map shows a valley for Lean FIRE plans that sit just under the personal allowance — but that valley has steep walls. A single year of unexpected spending (e.g., a new roof) pushes you over the cliff, triggering a 20% marginal rate on the excess. Meanwhile, the Fat FIRE contour at £3m shows a wide, stable plateau: the portfolio is large enough to absorb irregular spending inside the ISA wrapper. This is why the central thesis holds: the shape of your withdrawal strategy — not your withdrawal amount — determines the effective contour. Tools like the Portfolio Volatility Calculator: Annualised Standard Deviation can help you model the risk of crossing these boundaries, while a proper Retirement Calculator must account for this non-linear tax surface to avoid a misleading projection. ARIA PM handles survivorship adjustment, cost modelling, and regime stress-testing automatically — so you can focus on interpreting the contour rather than building the spreadsheet.
Key Takeaways
- A £60,000 annual withdrawal from a General Investment Account can generate less taxable income than a £15,000 withdrawal from dividend-paying funds, because capital gains are only 50% of the sale proceeds and benefit from a £3,000 annual exempt amount.
- The personal allowance does not fix your tax bill; the composition of your withdrawal — capital gains, dividends, or cash — determines if you remain inside it, not the total amount spent.
- Building a Fat FIRE portfolio around the £20,000 ISA allowance and the £3,000 capital gains exempt amount lets you generate a six-figure cash flow while keeping taxable income near zero.
- A Lean FIRE household drawing £15,000 entirely from dividend funds outside an ISA faces a 10.75% tax rate on income above £12,570, which can exceed the 18% capital gains tax paid by a Fat FIRE couple on a much larger withdrawal.
- Designing your withdrawal sequence to prioritise taxed accounts least and ISAs last means the shape of your strategy, not the sum you spend, flips the expected tax drag between Fat and Lean FIRE.
Table 1: Fat FIRE vs Lean FIRE-Tax and Withdrawal Dynamics
| Feature | Lean FIRE | Fat FIRE | Key Distinction |
|---|---|---|---|
| Annual spending target | Below £12,570 (Personal Allowance) | £80,000-£100,000+ | Lean targets zero income tax; Fat accepts higher tax burden |
| Income tax liability | £0 (nil-rate band) | Significant, but depends on withdrawal shape | Lean’s ‘obvious’ advantage can reverse with portfolio structure |
| Primary risk factor | Running out of money before spending growth | Tax drag from multiple taxable accounts | Withdrawal shape affects both survival and tax efficiency |
| Typical portfolio size | Lower, because spending is low | Significantly higher, to sustain large withdrawals | Size alone doesn't determine tax outcome — account mix does |
| Personal allowance interaction | Stays inside the allowance every year | May fluctuate in and out year-to-year | Withdrawal strategy — not spending level — dictates allowance access |
Table 2: Withdrawal Strategy-Impact on Tax Outcome
| Strategy Type | Portfolio Accounts Used | Effect on Personal Allowance | Tax Outcome vs £45,400 Spending |
|---|---|---|---|
| Single-account withdrawal | One ISA or GIA | Fixed; either inside or outside allowance | Predictable tax bill, but no flexibility |
| Multi-account blending | ISA + GIA + Pension | Can oscillate across allowance threshold | May pay less tax than single-account Fat FIRE |
| Shape-optimised withdrawal | Taxable and tax-sheltered accounts combined | Stays inside allowance in high-return years | Can beat Lean FIRE’s tax position despite higher spending |
| Fixed percentage withdrawal | One account, same % each year | No control over allowance boundary | Tax drag compounds with sequence risk |
| Monte Carlo modelled strategy | All accounts simulated with random returns | Allowance status varies by simulated year | Reveals whether shape — not size — determines tax efficiency |
Sources
- Pension Schemes Act 2026 — Defines 2026 pension legislation affecting access and withdrawal rules in the UK.
- Household total wealth in Great Britain - Office for National Statistics — Provides data on household wealth distribution relevant to FIRE planning.
- Analysis of Future Pension Incomes 2025 - GOV.UK — Forecasts future pension incomes to help estimate state and private pension returns.
- Individual Savings Accounts (ISAs): Overview - GOV.UK — Overview of ISA tax wrappers, key for tax-efficient savings and investments.
- Increasing Normal Minimum Pension Age - GOV.UK — Details changes to the minimum pension age, crucial for early withdrawal strategies.
- ISA reform 2027: anti-circumvention rules factsheet - GOV.UK — Explanations of new ISA anti-circumvention rules affecting flexible savers.