
Remember March 2020 or late 2022? Many UK investors watched their carefully diversified portfolios — spread across shares, bonds, and funds — plunge together during those market crises. This alarming co-movement highlights a critical vulnerability: diversification can fail precisely when you need it most, leaving retirement savings or key financial goals exposed.
Your Portfolio Volatility Calculator, which outputs an annualised standard deviation figure, does more than just show individual asset risk. Primarily, it acts as a crucial diagnostic tool, revealing the hidden fragility within your diversification strategy. This fragility surfaces during severe market stress, as asset correlations often surge towards 1, undermining the protective benefits of spreading investments.
This article explains why your 'safe' portfolio might not protect you when markets tumble. You'll uncover how diversification can unintentionally build risk, understand what your volatility number truly signals about crisis resilience, and learn practical steps to build a more robust portfolio — no prior expertise needed.
Why Your Diversification Might Fail When You Need It Most
Picture March 2020: global markets plunged as the pandemic struck. Investors who’d carefully diversified across stocks, bonds, and commodities watched in disbelief as all fell in unison. A portfolio split 60/40 between equities and bonds — historically a stabilising mix — dropped nearly 20% in weeks. This wasn’t a fluke; it was a brutal lesson in correlation convergence. When crises hit, assets that usually move independently suddenly lockstep together, erasing diversification benefits you counted on.
This is where your portfolio volatility calculator transforms from a simple risk gauge into a critical diagnostic tool. That annualised standard deviation figure — say, 15-20% for a typical diversified equity portfolio or 20-25% for a more aggressive mix — isn’t just about everyday swings. It quantifies your portfolio’s hidden fragility when correlations surge toward 1.0. In calm markets, low correlations between assets (e.g., stocks zigging while bonds zag) suppress volatility. But during a crisis, panic synchronises sell-offs. Your calculator’s output hints at how badly things could unravel when diversification’s safety net vanishes.
Looking ahead, the VIX (a key fear index) has stayed elevated despite some post-2022 moderation. Geopolitical shocks, like conflicts or trade wars, could again force correlations toward 1.0 with little warning. For UK investors, this convergence amplifies losses just as tax liabilities bite: a £10,000 portfolio dropping 25% leaves £7,500, but recovering to £10,000 requires a 33% gain — a harder climb with Capital Gains Tax allowances now at £3,000 and rates up to 24%.
Why should you care? Surface-level metrics like average returns ignore these crisis dynamics. Your volatility calculator reveals whether your "diversified" portfolio is truly resilient or just a collection of assets that seem uncorrelated until disaster strikes. Tools like our Correlation Calculator help stress-test relationships between holdings, while understanding the Sharpe Ratio — which uses standard deviation to measure risk-adjusted returns — becomes essential. For deeper analysis, combine your volatility readings with Markowitz Portfolio Optimisation principles to build robust allocations.
Don’t wait for the next crisis to expose your strategy. Use your Portfolio Calculator today to see the standard deviation lurking beneath calm markets — it might just reveal whether your diversification can withstand the storm. Explore all our Free Tools to refine your approach.
The Intuition: How Diversification Creates — and Hides — Portfolio Risk
Think of diversification like a suspension bridge. On calm days, its cables distribute weight independently, allowing cars to cross smoothly even in wind. But during an earthquake, those cables start swaying in unison — and the entire structure risks collapse. Similarly, your portfolio’s diversification works beautifully in normal markets, only to falter when crises force all assets to move together. This is where your portfolio’s annualised standard deviation acts as a stress test, revealing hidden fragility when correlations converge toward 1.
Consider a typical diversified portfolio: tech stocks (historically volatile at around 25%) paired with utilities (a gentler 12%). In ordinary times, these sectors often move independently. If tech plunges on regulatory news, utilities might hold steady or even rise as investors seek safety. This "zig-zag" effect smooths your overall returns, lowering portfolio volatility. Tools like our Portfolio Calculator help model this balance, showing how combining uncorrelated assets reduces risk.
But during market shocks — like the 2020 pandemic sell-off — correlations surge toward 1. Suddenly, tech and utilities plunge in lockstep. Diversification’s "cables" snap taut, and your portfolio’s volatility spikes toward the weighted average of its parts. That 25% tech volatility and 12% utilities volatility no longer offset each other; instead, they compound. Your annualised standard deviation, calculated using historical volatility data, captures this regime shift. It quantifies not just everyday swings, but the extreme risk that surfaces when diversification fails.
This is why a portfolio with a beta of 1.2 — 20% more volatile than the market — can unravel rapidly in crises. The standard deviation you see in our Portfolio Volatility Calculator isn’t just a backward-looking metric; it’s a warning light for hidden concentration risk. To navigate this, savvy investors:
- Stress-test correlations using our Correlation Calculator,
- Pair volatility metrics with risk-adjusted tools like the Sharpe Ratio,
- Rebalance strategically to avoid overexposure (e.g., trimming tech after rallies).
Diversification’s silent flaw is its tendency to mask tail risk. By quantifying volatility across all conditions — not just calm markets — the annualised standard deviation forces this fragility into the open. For deeper insights into optimising asset allocation, explore our guide on Markowitz Portfolio Optimisation or browse all Free Tools.
Deconstructing the Formula: Portfolio Volatility Calculation Step-by-Step
Portfolio volatility isn't just an average of your holdings' individual risks — it's a mathematical mirror reflecting how dangerously your assets can move in unison during market panics. To see why diversification often fails when you need it most, let's unpack the formula behind the calculation.
First, we define the building blocks in plain English:
- $\sigma_p$ is the annualised portfolio volatility (the number your calculator outputs)
- $w_i$ is the weight of asset $i$ in your portfolio (e.g., 0.6 for a 60% allocation)
- $\sigma_i$ is the annualised volatility of asset $i$ alone (its standalone risk)
- $\rho_{ij}$ (rho) is the correlation between assets $i$ and $j$, ranging from -1 (perfect opposites) to 1 (perfect lockstep)
The core formula for portfolio variance (volatility squared) is:
$$\sigma_p^2 = \sum_{i=1}^n w_i^2 \sigma_i^2 + \sum_{i=1}^n \sum_{j\neq i} w_i w_j \sigma_i \sigma_j \rho_{ij}$$
What this means is that total portfolio risk combines two distinct elements. The first term, $\sum_{i=1}^n w_i^2 \sigma_i^2$, captures each asset's individual risk contribution. Because weights are squared, smaller holdings contribute disproportionately less — a 10% weighted asset affects this term 100× less than a 100% holding. In other words, this says that concentrated positions dominate standalone risk.
The second term, $\sum_{i=1}^n \sum_{j\neq i} w_i w_j \sigma_i \sigma_j \rho_{ij}$, is where diversification lives or dies. It sums every possible pair of different assets ($i \neq j$), multiplying their weights, volatilities, and correlations. In other words, this quantifies how assets interact: low or negative $\rho_{ij}$ reduces risk (e.g., bonds rising when stocks fall), while high $\rho_{ij}$ amplifies it.
Now, the critical insight: during crises like 2008 or 2020, correlations ($\rho_{ij}$) often surge toward 1 as markets panic. When $\rho_{ij} = 1$ for all assets, the formula collapses to:
$$\sigma_p^2 = \left( \sum_{i=1}^n w_i \sigma_i \right)^2$$
Which simplifies to portfolio volatility becoming:
$$\sigma_p = \sum_{i=1}^n w_i \sigma_i$$
In other words, your portfolio volatility reduces to a simple weighted average of individual volatilities — as if diversification never existed. The "benefit" vanishes precisely when needed.
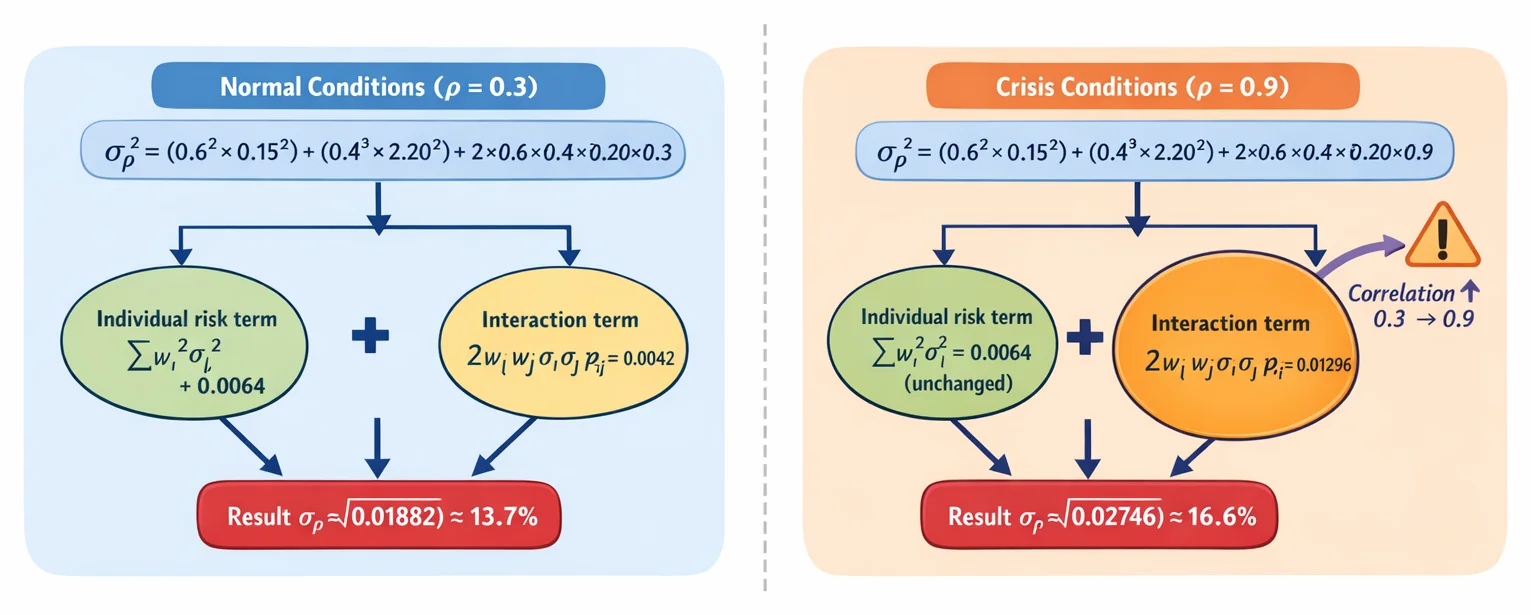
Consider this numerical example:
- Portfolio: 60% Asset A ($\sigma_A = 15%$), 40% Asset B ($\sigma_B = 20%$)
- Normal times: $\rho_{AB} = 0.3$ $\sigma_p^2 = (0.6)^2(0.15)^2 + (0.4)^2(0.20)^2 + 2(0.6)(0.4)(0.15)(0.20)(0.3) = $ $0.0081 + 0.0064 + 0.00432 = 0.01882$ $\sigma_p = \sqrt{0.01882} \approx 13.7%$
- Crisis times: $\rho_{AB} \uparrow 0.9$ $\sigma_p^2 = 0.0081 + 0.0064 + 2(0.6)(0.4)(0.15)(0.20)(0.9) = $ $0.0081 + 0.0064 + 0.01296 = 0.02746$ $\sigma_p = \sqrt{0.02746} \approx 16.6%$
Volatility jumps 21% despite unchanged weights or individual risks. Portfolios holding higher-risk assets can see even sharper increases when correlations surge from 0.3 to 0.9. This is the hidden fragility in your strategy: the correlation term acts like a trapdoor, eliminating diversification benefits during stress. When your volatility calculator outputs that annualised standard deviation, it’s not just a number — it’s a stress test revealing how close your portfolio is to becoming a bundle of synchronised risks.
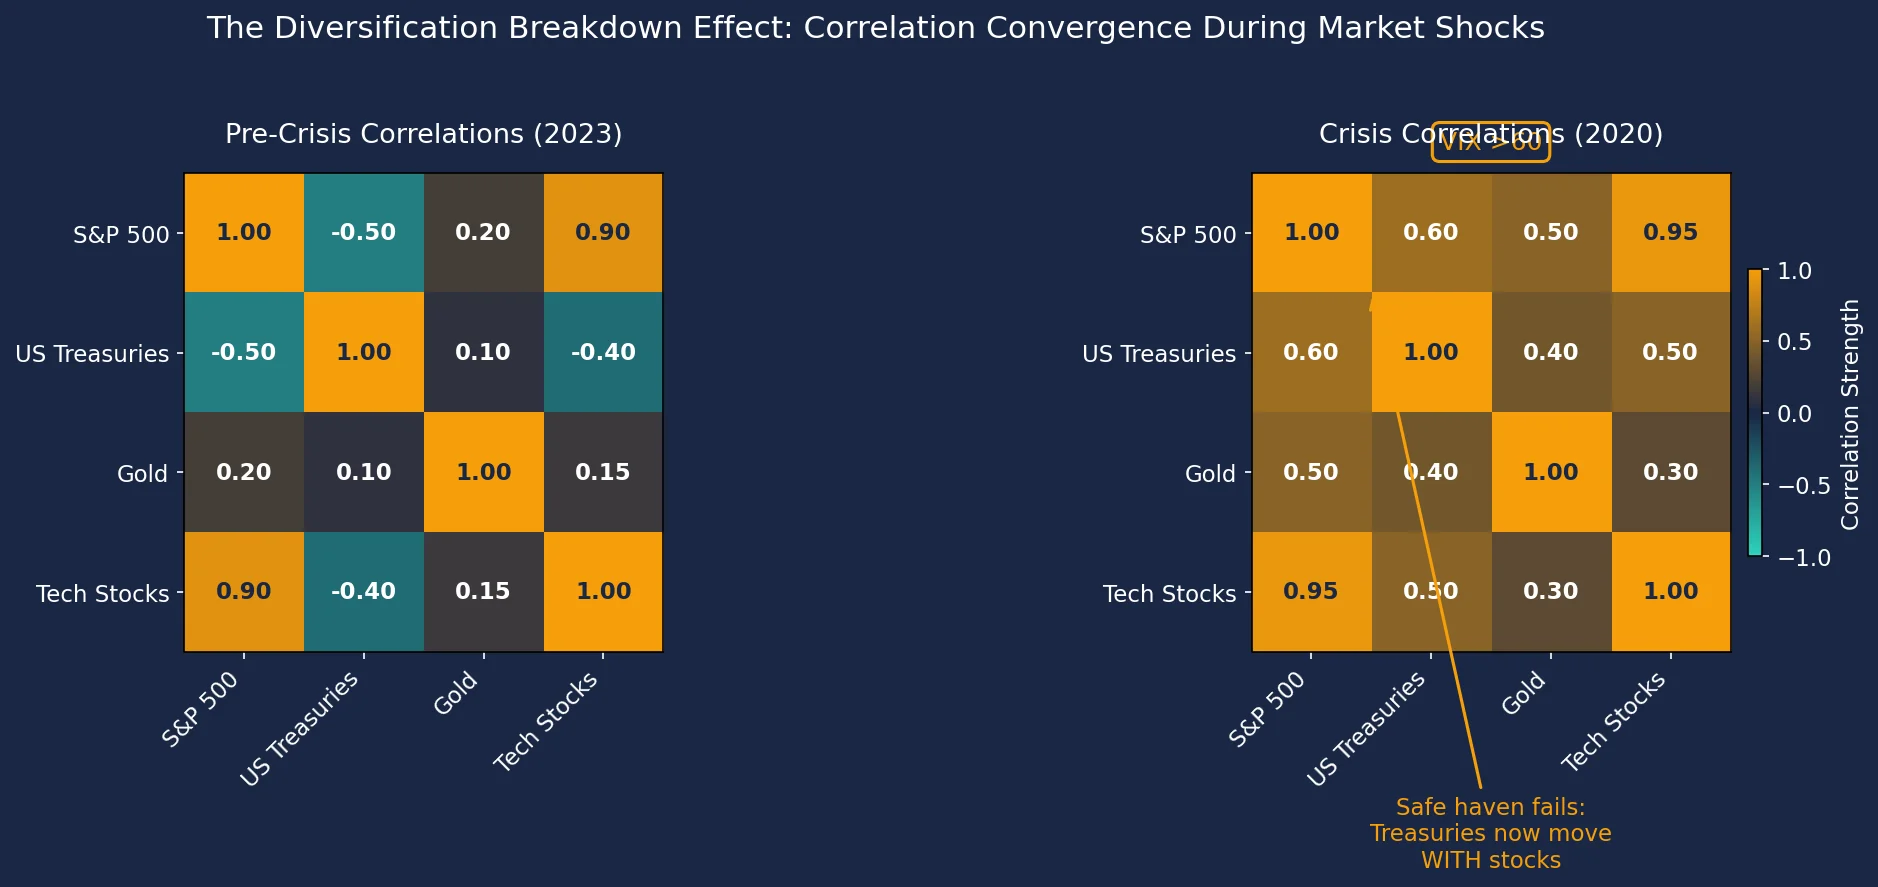
Visual Proof: Correlation Convergence During Market Shocks
When markets are calm, diversification works as expected: assets move independently, reducing overall portfolio risk. But during crises, this protection often vanishes. The chart below reveals how correlations between major assets converged during the 2020 market shock. Notice how US Treasuries — typically a safe haven — flipped from moving opposite to stocks to moving in lockstep with them. This convergence amplifies portfolio volatility precisely when you need stability most.
Interpreting Your Calculator's Output: What 15% Volatility Really Signals
So your portfolio volatility calculator spits out a number — say, 15%. What does this annualised standard deviation actually mean for your investments? At its core, it quantifies how wildly your portfolio’s returns might swing over a year. But its real value lies in exposing hidden risks that surface only when markets unravel.
Translating the Number: From Bonds to Growth Stocks
Think of volatility as a "risk dial":
- Below 10%: Bond-like stability (e.g., UK gilts or high-grade corporate debt).
- 10-15%: Typical for balanced funds mixing equities and bonds.
- 15-20%: Standard for FTSE 100 or diversified global stock portfolios.
- Above 20%: Growth-stock territory (tech shares, emerging markets) — where drawdowns can be severe.
Your 15% reading suggests a growth-focused portfolio. Statistically, this means in any given year, there’s a ~68% chance your returns will land within ±15% of their long-term average. But this assumes one thing: that your carefully built diversification holds.
The Hidden Fragility: When Diversification Fails
That 15% hinges on historical correlations between your assets. In calm markets, bonds might zig when stocks zag, dampening volatility. But during crises — like 2022’s inflation shock or March 2020’s pandemic panic — correlations converge toward 1. Everything falls together.
Your calculator’s output is a "fair weather" estimate. A portfolio showing 12% volatility in stable times might have spiked to 18% in 2022. Why? Diversification failed just when needed most. This is where tools like our Correlation Calculator help stress-test relationships between your holdings.
The VIX Test: Gauging Crisis Volatility
Benchmark your number against the VIX (the market’s "fear gauge"). When VIX readings exceed 30 — signalling panic, like during the 2008 crash or 2020 lockdowns — assume your portfolio’s realised volatility could run well above its normal level. A portfolio that looks calm at 15% can swing far more violently once panic sets in. Check VIX trends quarterly; if elevated, reassess your risk exposure.
Volatility Ranges: What Should You Do?
| Volatility Band | Investor Action |
|---|---|
| 20% | High risk of steep losses. Rebalance toward stable assets, hedge positions, or evaluate if returns justify volatility via the Sharpe Ratio. |
Turning Insight Into Action
A volatility reading isn’t just a static metric — it’s a call to fortify your strategy. Investors who proactively manage volatility stand a far better chance of avoiding the catastrophic drawdowns that permanently impair long-term returns. Start by:
- Stress-testing correlations during past crises.
- Comparing your volatility to the VIX during turbulent periods.
- Using optimisation tools (like Markowitz principles) to target efficient risk/return trade-offs.
ARIA PM automates regime stress-testing and correlation analysis — letting you focus on strategic decisions, not data crunching. Explore our full suite of Free Tools to refine your portfolio’s resilience. Remember: volatility isn’t just noise. It’s the alarm bell before the storm.
Limitations: Why Your Calculator Can't Predict the Next Crisis
While a portfolio volatility calculator provides a vital snapshot of historical risk, it’s critical to recognise its blind spots — especially when markets unravel. That seemingly reliable annualised standard deviation figure can mask hidden vulnerabilities that surface only during extreme stress. Here’s why:
1. The Past Isn’t a Reliable Playbook These tools rely heavily on historical data — for 2025 projections, they’ll typically use 2020-2024 figures. But black swan events, like the 2020 pandemic crash, rewrite the rules overnight. As correlations between assets converge toward 1 in crises (as they did in March 2020), diversification’s protective effect vanishes. Your calculator won’t flag this if its inputs predate the crisis. For 2025-2026, inflation surprises or geopolitical shocks could similarly invalidate historical patterns.
2. Correlations Aren’t Set in Stone Diversification hinges on assets moving independently, but during regime shifts, correlations break down. The 2022 bond-equity meltdown is a stark example: after decades of negative correlation, both plummeted together as central banks hiked rates. Your calculator’s output assumes past correlations hold — but as our Correlation Calculator shows, these relationships are dynamic. If bonds and stocks synchronise again in a future crisis, your "low-volatility" portfolio could unravel.
3. Tail Risks and Skew Are Ignored Standard deviation assumes market returns follow a symmetrical, bell-shaped curve. Reality is messier. Markets exhibit "fat tails" — extreme losses (or gains) occur far more often than the model predicts. It also ignores skew, where downside moves are sharper than upside ones. Your 8% annualised volatility might suggest modest risk, but it won’t warn you about a 20% single-day crash lurking in the tail.
4. The Normal Distribution Myth Volatility calculators typically assume normally distributed returns. Yet real-world markets are prone to violent, non-normal swings — like the 1987 Black Monday crash or the 2008 financial crisis. This oversight means your tool may underestimate the probability of extreme losses. For instance, a portfolio with a low beta (sensitivity to market swings) might appear stable, but in a crisis, even defensive assets can collapse in unison.
Navigating Uncertainty
These limitations don’t make volatility calculators useless — they make context essential. Pair your standard deviation reading with stress tests for inflation shocks or rate hikes. Consider how tools like the Sharpe Ratio might overstate risk-adjusted returns if tail risks are unaccounted for. Remember that traditional models, like Markowitz Portfolio Optimisation, share these blind spots.
For 2025-2026, with inflation volatility and geopolitical fractures, treat your calculator’s output as a starting point — not a forecast. Explore our Free Tools to model different regimes, but always layer in judgment for the unforeseeable. Markets don’t follow spreadsheets; your defence plan shouldn’t either.
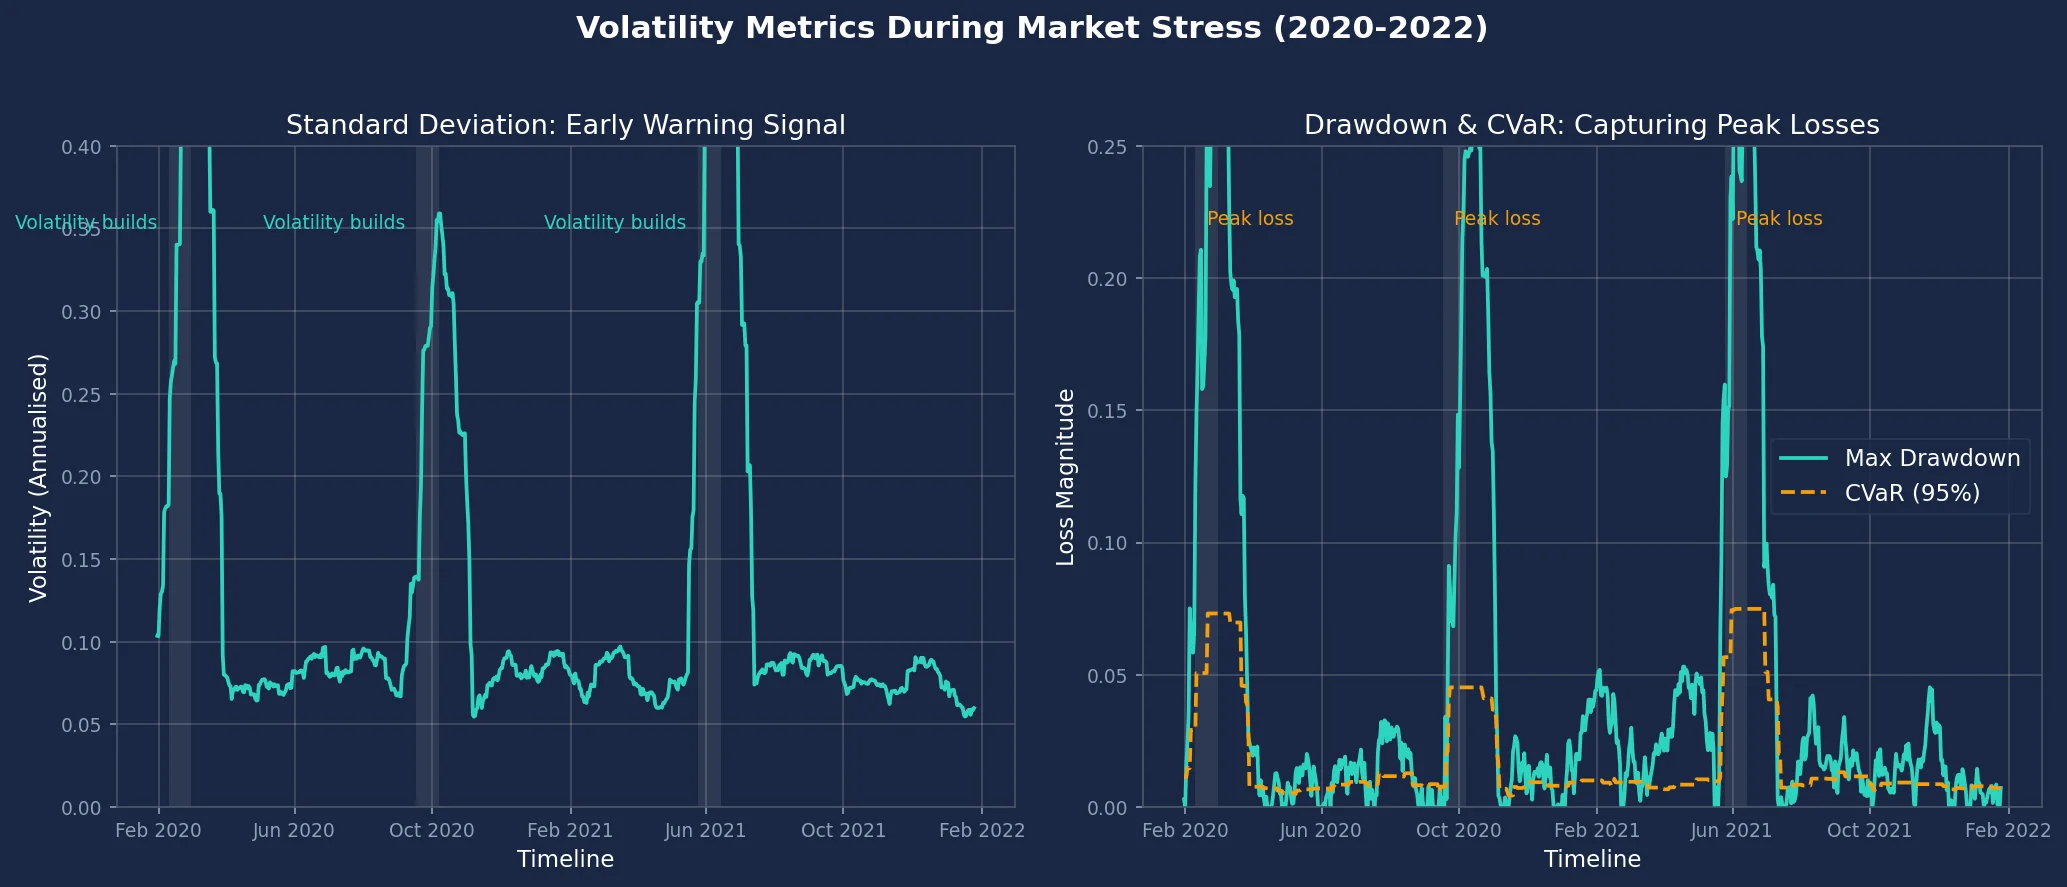
Beyond Standard Deviation: How Alternatives Compare in Crisis Scenarios
The annualised standard deviation of your portfolio often provides the first warning sign of hidden fragility, as it begins to rise when asset correlations creep up before a crisis. In contrast, drawdown and Conditional Value at Risk (CVaR) capture the peak pain during the crisis itself. This chart compares these three critical metrics across three market crises in 2020-2022. Look for how standard deviation (left) gradually increases in the weeks preceding each crisis, while drawdown and CVaR (right) spike sharply at the peak of the crisis. This demonstrates why annualised standard deviation remains essential for early fragility diagnosis, even as drawdown and CVaR quantify the severity of the crisis.
Action Plan: Building Truly Robust Portfolios
Your portfolio volatility calculator's output — the annualised standard deviation — is more than just a snapshot of past risk. It's a crucial diagnostic tool, flagging how vulnerable your diversification might be when markets panic and correlations surge towards 1. Here’s how to use it proactively to build genuine resilience:
- Run Monthly Checks, Focused on Correlation Assumptions: Don't just glance at the overall volatility number monthly. Use tools like our Correlation Calculator to track how the relationships between your assets are evolving. Are historically uncorrelated assets (like stocks and bonds) starting to move more in sync? This early warning sign, visible in rising portfolio volatility even if individual assets seem stable, signals that your diversification's protective power is weakening. Integrate this check with your regular review using our comprehensive Portfolio Calculator.
- Stress-Test with Crisis Correlations: Assume the worst. Periodically, manually override the correlation inputs in your volatility calculations, setting key asset pair correlations to 0.8 or even 0.9. How much does your portfolio's projected volatility spike? This "what-if" scenario reveals the hidden fragility masked by normal market conditions. If the stress-tested volatility jumps alarmingly (say, exceeding 15% when normally it's 10%), it's a dangerous concentration risk. Our platform, ARIA PM, handles this stress-testing automatically, letting you focus on interpreting the results.
- Diversify Across Volatility Regimes, Not Just Assets: True diversification considers how assets behave under different market environments. Incorporate assets with historically low correlation to equities and distinct volatility profiles, especially during inflation shocks. Consider commodities or gold — historically volatile sectors like energy can offer a potential hedge when traditional stocks and bonds falter together. This isn't about chasing returns; it's about adding sources of risk that don't align perfectly during systemic stress.
- Use Volatility Spikes as Rebalancing Signals: A significant, sustained increase in your calculated portfolio volatility is a red flag. It often precedes or coincides with market stress where diversification fails. Treat this spike as a signal to rebalance towards your target asset allocation. Sell assets that have become overweight (and likely more correlated) and buy underweighted ones. Remember, rebalancing incurs costs: factor in the 0.5% Stamp Duty Reserve Tax (SDRT) on UK share purchases and potential Capital Gains Tax (CGT) if gains exceed your £3,000 annual exempt amount in taxable accounts. Using tax-efficient wrappers like ISAs (£20,000 annual allowance) shields you from CGT and dividend tax on rebalancing gains and income.
- Set 'Correlation Buffer' Thresholds: Define explicit rules based on your volatility metric. For example: "If my portfolio's annualised standard deviation exceeds 1.5 times the weighted average volatility of its individual components, I will reduce overall risk exposure by 10%." This forces action when the maths shows your diversification is providing less protection than expected, likely due to rising correlations. Understanding your portfolio's risk-adjusted potential, perhaps by calculating your Sharpe Ratio, helps contextualise these thresholds within your overall strategy, grounded in principles like Markowitz Portfolio Optimisation.
The Core Insight: Your portfolio volatility number isn't merely a measure of individual asset risk. It's your diversification health monitor. When it rises unexpectedly, especially during relative calm in individual markets, it's sounding the alarm that your portfolio's structural defences — its reliance on assets moving independently — are weakening. By actively monitoring, stress-testing, diversifying strategically, and acting on volatility signals, you transform this diagnostic tool into the foundation for building portfolios that can weather the storms when correlations inevitably converge. Explore more strategies in our Free Tools section.
Key Takeaways
- Your portfolio's annualised standard deviation figure primarily quantifies its hidden fragility when market crises force asset classes to move together, erasing diversification benefits.
- Use the volatility calculator's output to diagnose whether your "diversified" portfolio can realistically withstand periods when correlations converge towards 1.0, like during the March 2020 crash.
- With the VIX prone to staying elevated, proactively assess your portfolio's calculated volatility to gauge potential losses during future geopolitical or economic shocks.
- UK investors should factor in how higher portfolio losses (indicated by volatility) significantly increase the after-tax hurdle for recovery, especially with the £3,000 capital gains tax allowance and rates up to 24%.
- Prioritise understanding your portfolio's volatility metric over average returns, as it reveals the true resilience of your diversification strategy during crisis-driven correlation spikes.
| Metric | Focus Area | Crisis Sensitivity | Captures Tail Risk? | Ease of Interpretation |
|---|---|---|---|---|
| Annualised Standard Deviation | Overall return volatility | Moderate (rises with correlation spikes) | No | Moderate (requires context) |
| Maximum Drawdown | Worst historical loss | High | Partial | Easy (intuitive) |
| Conditional Value at Risk (CVaR) | Extreme tail losses | Very High | Yes | Hard (complex) |
Asset Class Behaviour: Calm vs. Crisis Markets
| Asset Class | Normal Conditions (Correlation) | Crisis Conditions (Correlation) | Diversification Reliability |
|---|---|---|---|
| Equities | Low/mixed | High (≈1.0) | Weakens severely |
| Government Bonds | Negative to equities | Moderate/positive | Often fails |
| Corporate Bonds | Moderate positive | High (≈0.8-1.0) | Frequently collapses |
| Commodities | Low | Volatile (spikes to ≈0.7-1.0) | Unpredictable |
Sources
- SEC Investor.gov: Standard Deviation — Investor.gov glossary entry explaining standard deviation as a measure of investment risk.
- FCA InvestSmart: Understanding high-risk investments — FCA guidance on investment risks, including volatility measurement principles.
- Investopedia: Standard Deviation — Definition, calculation methodology, and practical application for portfolios.
- Morningstar: Volatility Statistics — Methodology for calculating volatility metrics like standard deviation in fund analysis.
- Portfolio Visualizer: FAQ — Documentation of Portfolio Visualizer's metrics, including annualised standard deviation.
- CFA Institute: Portfolio Risk and Return (Refresher Reading) — Practitioner-level explanation of standard deviation in portfolio risk management.


