
Sarah, a UK investor, analysed her ISA holdings in Portfolio Visualizer. The results seemed off — her GBP-denominated funds showed artificially low volatility after automatic USD conversion. This hidden currency layer distorts risk, obscures true tax liabilities on dividends, and misrepresents performance. For UK portfolios, such USD-centric tools don't just lack local data; they actively generate misleading analysis, potentially costing you through poor asset allocation or unexpected tax bills. So, how do you find a Portfolio Visualizer Alternative for UK Investors that accurately handles UK stocks, funds, tax wrappers, and currency? This guide cuts through the confusion. We'll pinpoint essential UK-specific features, compare real alternatives with native data support, and show you how to avoid critical analysis mistakes — no technical expertise needed.
Why Portfolio Visualizer Falls Short for UK Investors (And Why It Matters)
You've meticulously researched your next UK equity investment or ISA strategy. You fire up a popular analysis tool like Portfolio Visualizer — widely used by investors worldwide and supporting assets across many markets — to model potential outcomes. But frustration quickly sets in. While you can technically input a UK stock ticker, the results feel fundamentally off. The core issue isn't just that Portfolio Visualizer lacks deep UK-specific data feeds; it's that forcing your UK-centric portfolio through its inherently USD-centric analysis engine actively distorts the reality you face as a UK-based investor. This distortion permeates critical areas: risk assessment, tax implications, and performance attribution.
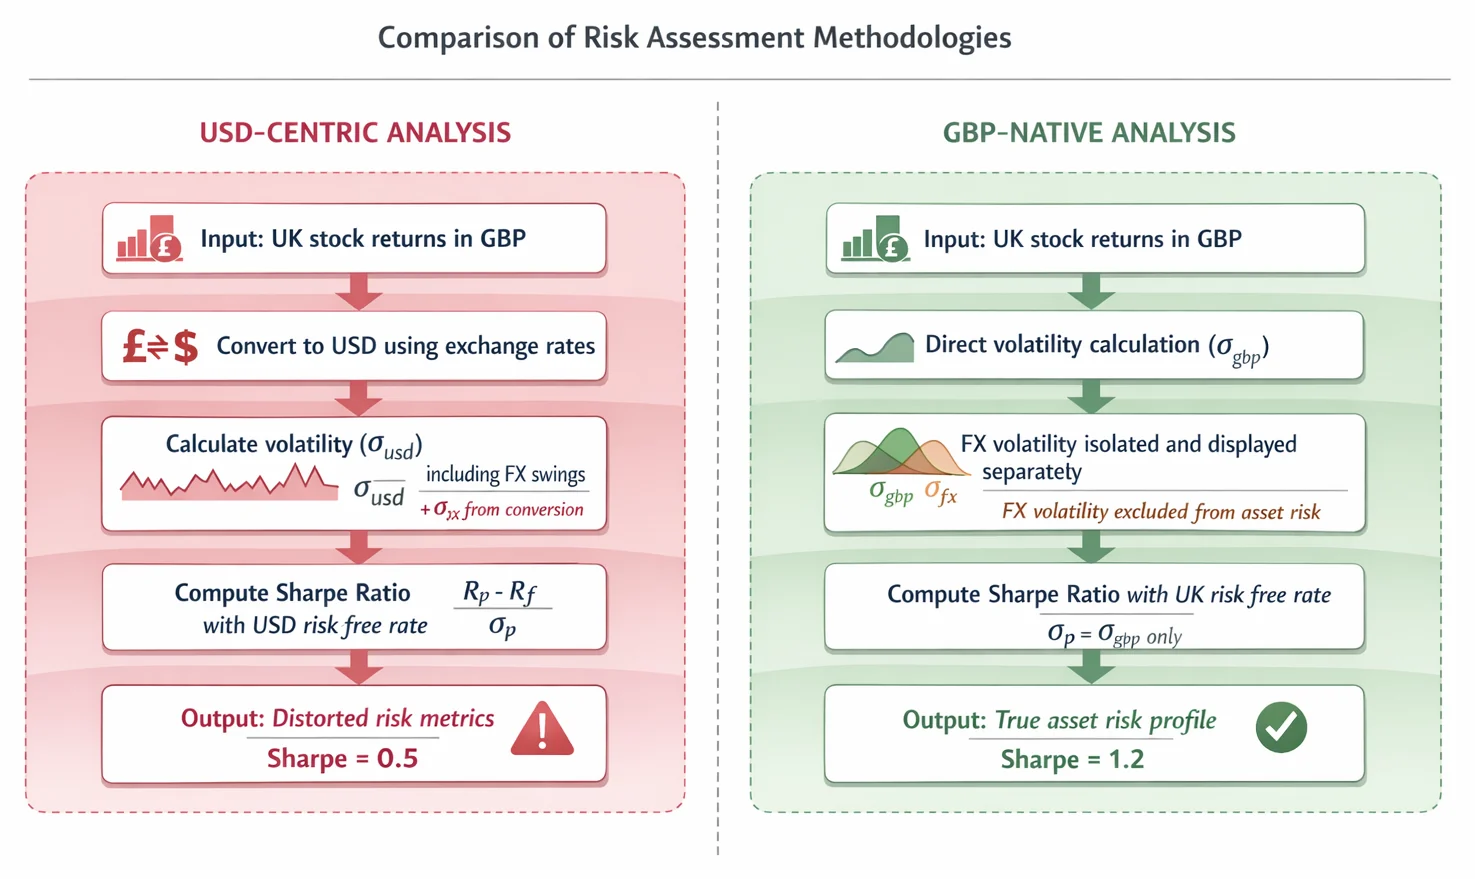
Consider risk first. Portfolio Visualizer's default lens is the US dollar. When analysing a portfolio containing UK assets (like those listed on the FTSE 100 or AIM), the tool inherently treats currency fluctuations between GBP and USD as part of the asset's volatility. Imagine a stable UK stock. If the pound weakens significantly against the dollar during your backtest, Portfolio Visualizer will likely report higher volatility and potentially a lower Sharpe Ratio for that holding. This misattributes currency risk (which you may or may not be actively managing) as inherent asset risk, skewing your understanding of the investment's true behaviour within your GBP-denominated world. Tools like our Correlation Calculator highlight how currency movements can distort perceived relationships between investments when viewed through the wrong currency lens.
Tax calculations become dangerously inaccurate. UK Capital Gains Tax (CGT) is calculated based on gains realised in pounds sterling. Portfolio Visualizer, crunching numbers primarily in USD, provides gain/loss figures in dollars. Converting these back to GBP using simplistic or incorrect exchange rates (especially for historical transactions) leads to flawed CGT estimates. A seemingly profitable trade in USD might be a loss in GBP after accurate FX conversion, or vice versa. Relying on this for tax planning is a recipe for errors and potential HMRC complications. Accurate tax modelling requires native GBP tracking from the outset, something our ROI Calculator demonstrates the importance of when calculating true net returns.
Finally, performance attribution — understanding why your portfolio performed as it did — gets muddied. Did your UK equity fund deliver strong returns because of savvy stock picking, or simply because the pound weakened against the dollar during the period? Portfolio Visualizer's USD focus makes it exceptionally difficult to separate genuine asset performance from the noise of currency movements. This lack of clarity hinders effective strategy refinement. Understanding the underlying drivers, as explored in concepts like Markowitz Portfolio Optimisation, is crucial but impossible if currency signal is lost in translation.
This matters profoundly because the global portfolio management software market — growing steadily as adoption widens — is increasingly integrating sophisticated features like AI-driven predictive analytics. However, these advanced capabilities are rendered misleading for UK investors if the foundational data and currency framework are misaligned. Using a tool that forces USD analysis is like navigating London with a map of Manhattan; some landmarks might look familiar, but the routes, scales, and rules are fundamentally wrong. Finding a true alternative isn't just about convenience; it's about ensuring the accuracy of your risk profile, tax liabilities, and the genuine performance drivers of your hard-earned capital. Explore our suite of Free Tools designed with UK investors in mind, or use our Investment Calculator to model GBP-based growth scenarios accurately.
Non-Negotiable Features: What Makes a Truly UK-Capable Portfolio Tool
For UK investors, a portfolio analysis tool isn't truly fit for purpose unless it addresses the unique distortions caused by USD-centric platforms. The strategic portfolio management market is growing rapidly, driven by demand for localised solutions. Here’s what to prioritise:
1. GBP as the Native Base Currency Currency conversion ≠ true GBP-based analysis. If your tool calculates returns in USD, a "10% gain" could mask a 5% loss in pounds after exchange-rate swings. For example, a £10,000 investment in a USD asset rising 10% would be worth $11,000. But if sterling strengthens 15% against the dollar, you’d actually have just £9,565 — a net loss. Native GBP support ensures performance reflects your real purchasing power, not distorted currency noise. This precision is critical for tools like our Investment Calculator, which models compound growth in pounds.
2. Comprehensive UK Asset Coverage Your portfolio likely holds London Stock Exchange (LSE) shares, AIM stocks, or UK-focused ETFs like Vanguard FTSE U.K. All Share Index. Omitting these — as many USD-centric tools do — makes backtesting irrelevant. A tool must include mainstream UK assets to accurately model diversification or test strategies like pairing FTSE 100 stocks with gilts. Without this, you’re analysing a fictional portfolio.
3. UK Tax & Dividend Modelling UK dividends have unique tax treatments (e.g., the £500 tax-free dividend allowance for 2024/25, then dividend tax at 8.75%, 33.75%, or 39.35% depending on your income band) and capital gains require specific calculations. A platform must automatically factor in:
- Dividend accruals (critical for income-focused portfolios)
- Capital gains tax bands and annual exemptions
- ISA or SIPP tax wrappers Ignoring these turns a "7% annual return" into a misleading figure — after taxes, your net gain could be 4.5%. Use our ROI Calculator to stress-test post-tax outcomes.
4. Local Benchmarks & Inflation Data Comparing your portfolio to the S&P 500 is meaningless if you’re investing in UK assets. Tools must include benchmarks like the FTSE All-Share or FTSE 250. Similarly, inflation dramatically impacts long-term wealth: £10,000 at 2% UK inflation loses £1,800 of purchasing power over 10 years. Integrating UK-specific inflation data ensures performance metrics reflect real-world erosion of value.
Why Personalisation Matters This shift toward localisation isn’t niche — it’s mainstream. Demand for customised solutions has grown strongly, with investors increasingly prioritising tools that adapt to their reality. Modern platforms achieve this through operational efficiency, handling complex UK tax rules or multi-asset simulations without manual work. For instance, assessing how UK gilts reduce portfolio volatility requires accurate data and tools like our Correlation Calculator.
Ultimately, a tool that lacks these features doesn’t just "miss" UK data — it actively misleads. As you evaluate alternatives, prioritise platforms that ground analysis in the economic and regulatory landscape you actually inhabit. For deeper dives into risk-adjusted metrics, see our Sharpe Ratio Guide or explore free tools designed for UK contexts.
Step-by-Step: How UK Portfolio Analysis Works in Practice
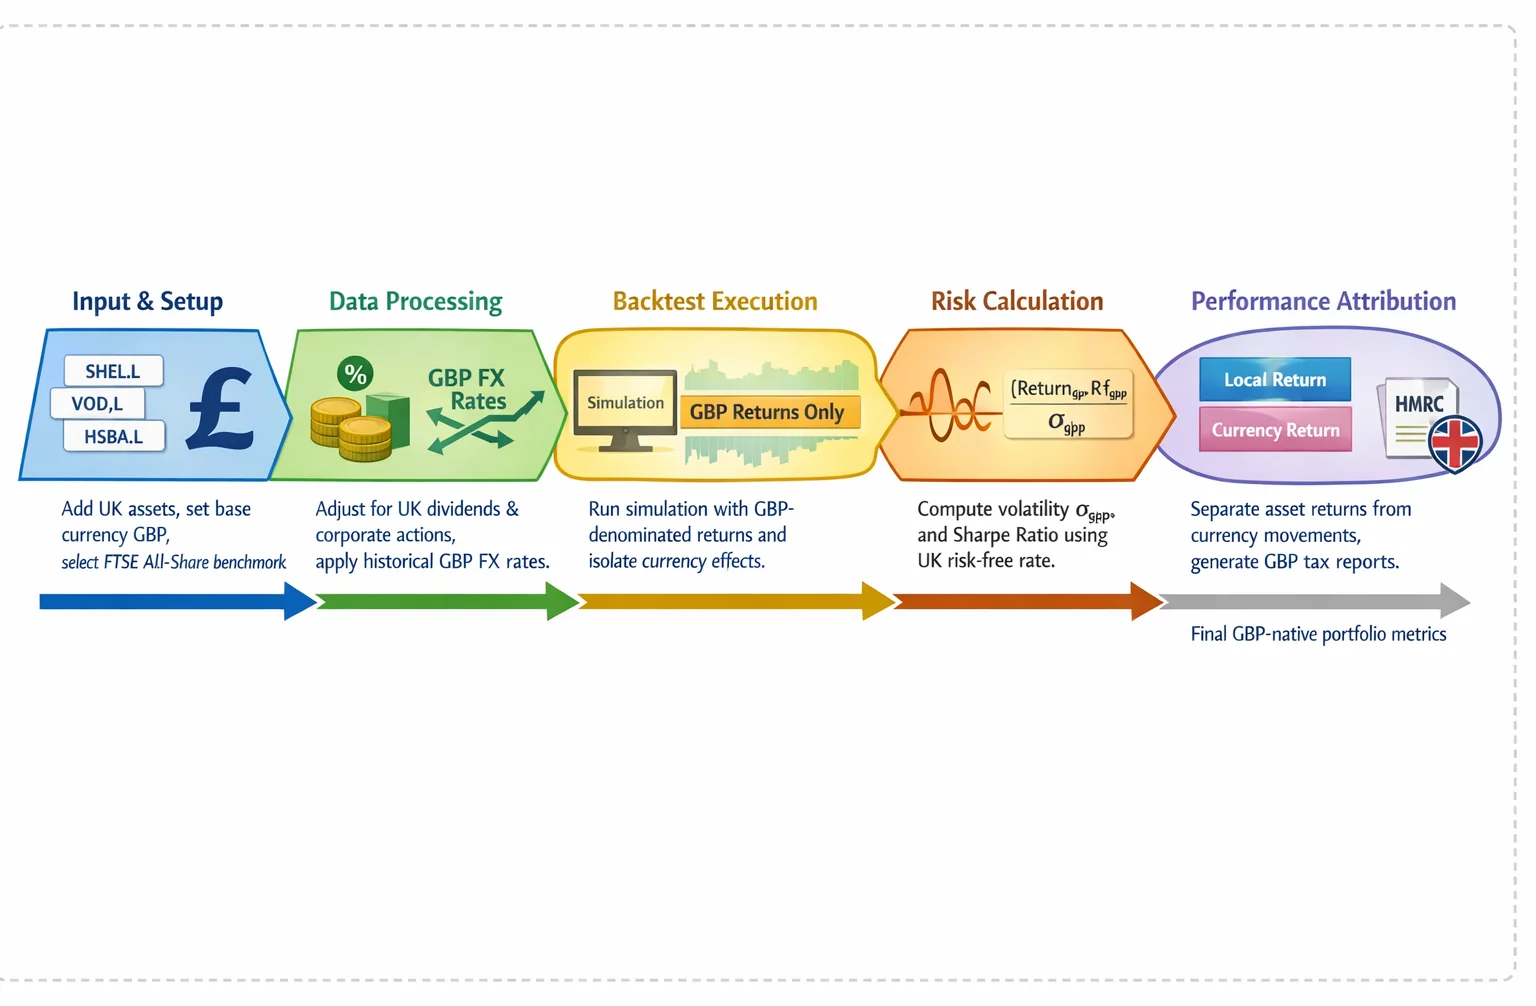
Imagine you’re evaluating a UK-focused portfolio with holdings like the Vanguard FTSE UK All-Share ETF. Here’s how a tool designed for UK investors — unlike USD-centric platforms like Portfolio Visualizer — ensures accurate analysis:
Input UK-Specific Holdings Start by adding your actual investments: UK shares, ETFs, or funds (e.g., "Vanguard FTSE UK All-Share ETF"). A UK-optimised tool recognises these assets natively, avoiding the manual adjustments needed in US-focused platforms. This eliminates errors that arise from mismatched tickers or incomplete data.
Set Base Currency to GBP Select GBP as your analysis currency. This is critical because Portfolio Visualizer defaults to USD, artificially inflating/deflating returns due to exchange-rate swings. For example, a 10% USD gain might only be 6% in GBP after currency costs — distorting true performance.
Choose UK-Relevant Benchmarks Compare your portfolio against appropriate benchmarks like the FTSE 100 or FTSE All-Share, not the S&P 500. This reveals whether your strategy actually outperforms the UK market, rather than an irrelevant US index.
Run Backtests with GBP-Adjusted Data Execute the simulation using historical data converted to GBP. A proper tool adjusts for UK-specific factors like dividend withholding taxes and fund structures. For instance, a £10,000 investment in the FTSE 100 growing at 7% annually over 10 years becomes £19,672 — not a USD equivalent skewed by forex volatility.
Interpret GBP-Denominated Metrics Review results in pounds:
- Volatility: "Your 12% annual volatility reflects genuine UK market risks — not just USD/GBP fluctuations."
- Sharpe Ratio: "A ratio of 0.8 means your returns are 0.8x the UK risk-free rate after accounting for GBP volatility." For deeper insights, see our Sharpe Ratio Explained guide.
- Correlation: Use our Correlation Calculator to check how UK assets interact (e.g., gilts vs. equities during recessions).
Why This Matters Most portfolio software is built first for the North American market — explaining why these tools prioritise USD data. For UK investors, this creates hidden distortions:
- A "low-risk" US fund might appear volatile when converted to GBP.
- Tax liabilities from foreign dividends get overlooked.
- Performance attribution mislabels currency effects as stock-picking skill.
Tools like ARIA PM handle survivorship adjustment, cost modelling, and regime stress-testing automatically — so you can focus on interpreting results rather than building the simulation. For hands-on practice, try our Free Tools to model ISA contributions or test diversification principles from our Markowitz optimisation explainer.
Ultimately, native GBP analysis transforms vague estimates into actionable insights. Whether projecting retirement income with our Investment Calculator or measuring returns with the ROI Calculator, UK-centric data ensures your strategy aligns with reality — not currency noise.
Top Portfolio Visualizer Alternatives for UK Investors: Real Tools Compared
For UK investors seeking alternatives to Portfolio Visualizer, the critical factor isn't just finding similar features — it's ensuring those tools natively integrate UK market data and tax rules. Without this, even sophisticated analysis distorts crucial elements like risk exposure, Capital Gains Tax (CGT) Reports, and performance attribution. Here’s how leading alternatives compare, focusing on UK-specific capabilities:
- PortfoliosLab: Covering much of the same core ground as Portfolio Visualizer in functions like backtesting and correlation analysis, PortfoliosLab stands out for its accessible approach. It supports UK stocks and funds, enabling realistic simulations of FTSE 100 or ISA holdings. Its strength lies in intuitive historical backtesting, letting you model strategies using actual UK market behaviour. Pricing follows a freemium model: a free tier with paid plans for more history and advanced metrics. For UK investors, its integration of London Stock Exchange data means your volatility and diversification metrics reflect real local conditions, not USD proxies. Explore its capabilities further using our Correlation Calculator to test UK asset relationships.
- Koyfin: Well regarded by advisors for usability and depth, Koyfin provides extensive coverage of UK equities, including LSE pricing and fundamentals. It offers a library of pre-built model portfolios, which can jumpstart UK-centric strategy development. Key tools include advanced charting, economic data dashboards, and portfolio risk analytics. It offers a free plan alongside paid premium subscriptions. Its UK-specific advantage is the granularity of London market data, crucial for accurate correlation analysis and sector exposure checks when building diversified portfolios aligned with UK economic cycles.
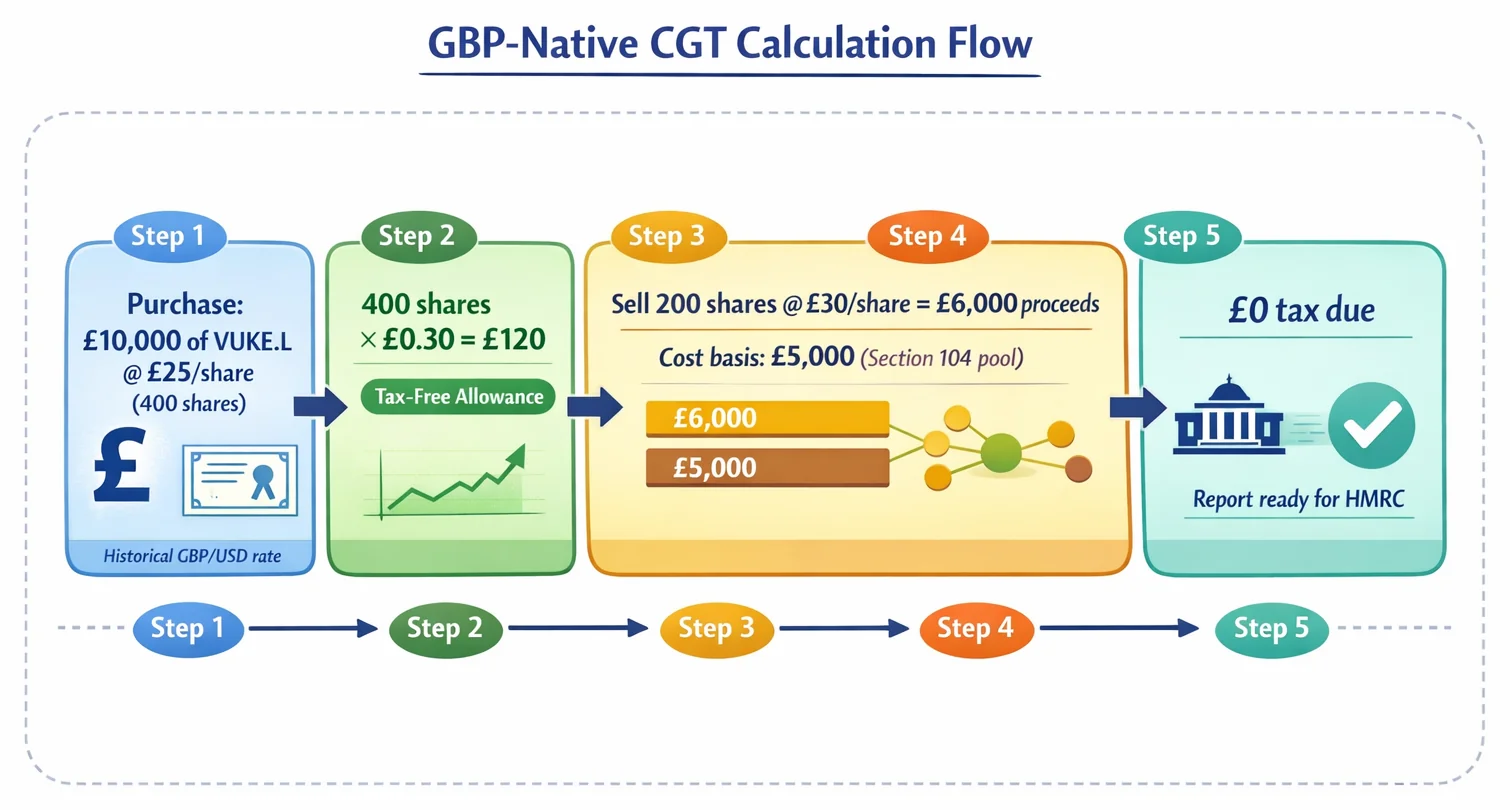
- Sharesight: This platform excels in practical portfolio management for global investors, tracking securities across many markets with strong depth for UK holdings. Its standout feature is automated income and Capital Gains Tax (CGT) Reports, handling HMRC complexities like Section 104 pooling and bed-and-breakfasting rules. This transforms messy capital gains calculations into clear, audit-ready statements. Pricing is tiered, from a free entry plan up to paid plans for larger portfolios. For UK investors managing taxable accounts (like GIAs alongside ISAs), Sharesight’s tax automation saves hours and prevents costly errors, making it indispensable for compliance.
- Mezzi: Targeting sophisticated investors, Mezzi uses AI to help optimise after-tax returns and is offered on a premium annual subscription. It projects how different disposal strategies might impact net wealth, with features including multi-asset analysis and custom benchmark comparisons. Note that Mezzi is built primarily for the US market, so confirm how it handles UK-specific rules such as dividend tax, CGT, and ISA allowances before relying on it for HMRC compliance.
Free vs. Premium & The Data Gap: While free tools exist, they often lack UK focus. For example, GuruFocus covers a large universe of global stocks but offers limited depth on smaller UK companies or funds. Free alternatives typically cover only a fraction of Portfolio Visualizer’s analytical functions and rarely support UK tax logic. Premium tools justify their cost through accurate, locally relevant data and automation — for instance, a UK-specific platform reflects how your dividend and capital gains are taxed under HMRC rules (the £3,000 annual CGT exemption and £500 dividend allowance for 2024/25) rather than reporting a raw, pre-tax figure. This precision is non-negotiable for realistic planning.
Choosing the right alternative means prioritising tools that embed UK market structures and HMRC rules into their core — not as an afterthought. For deeper insights into optimising UK portfolios, see our guide on Markowitz Portfolio Optimisation: Plain English or calculate potential returns with our Investment Calculator.
Critical Mistakes UK Investors Make (And How to Avoid Them)
UK investors often rely on powerful portfolio analysis tools without realising how USD-centric assumptions fundamentally distort their results. The core issue isn't just missing UK data — it's how forcing GBP investments into dollar-based frameworks warps risk, income, and tax outcomes. Here are critical pitfalls and how to avoid them:
1. Analysing GBP Portfolios in USD Terms
Using tools like Portfolio Visualizer for UK holdings introduces hidden currency risk. A 10% USD-denominated "return" could mask a -2% GBP loss after exchange rate swings. This distorts your true risk exposure and misrepresents volatility. For example, a tool might show smooth growth for a US tech ETF while ignoring the pound's 15% slump against the dollar in 2022. Fix: Always run a currency impact report before trusting results. Verify if tools natively support GBP as the base currency for returns and volatility calculations. Our Sharpe Ratio Explained guide details how currency skews risk metrics.
2. Overlooking Dividend Accruals
UK equities have historically offered meaningful dividend yields, often higher than many US stocks. Tools that ignore reinvested dividends (common in free tiers) can materially understate long-run returns. Imagine investing £10,000 in the FTSE 100: with dividends reinvested at a 7% total return, you'd have roughly £19,672 in a decade. On price growth alone at 5%, you'd have about £16,289 — a sizeable shortfall driven entirely by the dividends a USD-centric tool may overlook. Fix: Prioritise tools with granular dividend tracking, especially for ISA and SIPP accounts where dividends compound tax-free. Confirm historical dividend data covers LSE stocks, not just ADRs.
3. Ignoring UK Tax Mechanics
Most global tools omit Capital Gains Tax (CGT) allowances and ISA/SIPP rules. A backtest showing a £20,000 gain leaves £17,000 taxable after the £3,000 annual exempt amount (2024/25), costing roughly £3,060 in CGT at the 18% basic rate or £4,080 at the 24% higher rate. Tax wrappers change outcomes drastically: £10,000 growing at 7% annually for 20 years becomes £38,697 either way, but in a taxable account the £28,697 gain (less the £3,000 exemption) attracts CGT of around £4,600–£6,200 depending on your rate, whereas in an ISA the whole sum is tax-free. Fix: Use tools modelling UK-specific thresholds. For pensions, ensure SIPP tracking includes contribution limits and withdrawal rules.
4. Trusting "Global" Platforms Without Verification
Many alternatives claim UK support but rely on sparse or stale LSE data. Some "global" platforms list only a partial slice of the FTSE 100 — omitting major constituents like AstraZeneca. Fix: Verify tools include LSE tickers, not just ADRs. Test with UK-centric assets like gilts or investment trusts. Several free-tier alternatives exist, but they typically offer only partial feature parity with premium tools.
The portfolio tools market continues to grow, with new solutions addressing these gaps. For accurate UK modelling, prioritise platforms with native GBP handling, HMRC-compliant tax logic, and dividend tracking. Explore our curated Free Tools list for vetted options. As you evaluate alternatives, remember: minor distortions compound dramatically. A 0.5% annual error from currency or tax oversights could cost roughly £900 on a £10,000 investment over 10 years.
ARIA PM handles survivorship adjustment, cost modelling, and regime stress-testing automatically — so you can focus on interpreting results rather than building the simulation. For deeper dives into portfolio construction, see our Markowitz Optimisation guide.
Your Action Plan: Finding and Testing the Right UK Alternative
Step 1: Audit Your Portfolio for UK-Specific Assets Start by listing every UK-focused investment: London Stock Exchange (LSE) shares (e.g., Shell PLC or Unilever), UK-domiciled funds, or ISA holdings. Identify assets where currency conversion, dividend tracking, or tax treatment could skew results. For example, a GBP-denominated bond fund analysed in USD distorts yield calculations and volatility metrics. This step ensures you prioritise tools that handle local data intrinsically.
Step 2: Shortlist Tools Using a UK-Centric Checklist From Section 4’s alternatives, filter 2-3 options with this criteria:
- GBP as base currency: Avoids forced USD conversions that misrepresent returns.
- LSE/UK market coverage: Confirms access to FTSE indices, AIM stocks, and corporate actions.
- Tax features: Automated dividend matching (reconciling payouts with holdings) and Section 104 share-pooling support (calculating average cost basis for Capital Gains Tax). Even broad, widely used platforms like GuruFocus may lack these UK specifics. Verify before committing.
Step 3: Test with a Real UK Holding Run a focused backtest using a core position like Shell PLC:
- Input: "£10,000 in SHEL.L vs. FTSE 100 benchmark, 2019-2024".
- Compare outputs:
- GBP returns: Check if dividends and capital gains are GBP-native (not converted).
- Risk metrics: Contrast volatility and Sharpe ratios with USD-based results. Currency fluctuations inflate risk in dollarised tools — our Sharpe Ratio Explained guide deciphers this.
- Dividend tracking: Confirm automated matching of payouts to holdings (e.g., Shell’s quarterly dividends). Accurate projections matter — a 7% GBP return compounded over 10 years grows £10,000 to £19,672; a distorted 6.5% yields only £18,771 (a £901 gap). Use our Compound Interest Calculator to stress-test outcomes.
Step 4: Start Trials and Compare Begin with free tiers. Koyfin, for instance, is well regarded for value among UK advisors and offers solid LSE coverage — ideal for initial Shell PLC tests. For advanced modelling (e.g., multi-asset ISA optimisation), tools like ARIA PM automate survivorship bias adjustment, cost scenarios, and tax-regime stress-testing. Explore our Free Tools hub for supplementary calculators.
Final Tip Always cross-verify tax outputs: if a tool can’t apply Section 104 rules (aggregating Shell shares purchased at different times into one pool), your CGT estimates will be unreliable. For portfolio construction principles, see our Markowitz Optimisation Guide.
Stuck? We address common hurdles — like reconciling dividend histories or adjusting for FX fees — in the upcoming FAQ. Start testing today to align your strategy with UK realities.
Key Takeaways
- Portfolio Visualizer's USD-centric analysis distorts risk assessment, tax calculations, and performance attribution for UK investors holding GBP-denominated assets.
- Its risk metrics misrepresent UK assets by incorrectly treating GBP/USD currency fluctuations as part of the asset's inherent volatility.
- Capital Gains Tax calculations become inaccurate as Portfolio Visualizer reports gains/losses in USD, not the required sterling basis for UK tax.
- Performance attribution is skewed because currency movements are embedded within the reported returns of UK assets.
- Truly effective alternatives must process all data natively in GBP to avoid these fundamental distortions.
| Analysis Aspect | USD-Centric Approach (e.g., Portfolio Visualizer) | UK-Native Approach | Key Risk for UK Investors |
|---|---|---|---|
| Base Currency | Forces GBP holdings into USD calculations | Native GBP as base currency | Distorts true portfolio value by adding artificial FX volatility |
| Risk Assessment | Measures volatility in USD terms | Measures volatility in GBP terms | Overstates risk for GBP-denominated assets |
| Performance Attribution | Attributes returns to USD benchmarks | Uses UK indices (e.g., FTSE All-Share) | Misrepresents UK asset drivers and sector exposure |
| Tax Calculation | Ignores UK tax wrappers (ISAs) and dividend rules | Integrates UK tax bands/allowances | Inaccurate after-tax return projections |
| Cost Basis | Defaults to USD-adjusted acquisition costs | Trades in GBP with LSE pricing | Misleads CGT liability calculations |
UK Portfolio Tool Requirements Checklist
| Critical Feature | Why It Matters for UK Investors | Portfolio Visualizer Limitation | Essential for Accurate Analysis? |
|---|---|---|---|
| GBP Base Currency | Eliminates artificial FX noise in returns | USD forced as default | Mandatory |
| LSE Data Integration | Accurate pricing for UK shares/funds (e.g., Shell, Unilever) | Limited UK equity coverage | Mandatory |
| UK Tax Rule Support | Models ISA tax shielding & dividend allowances | US tax frameworks only | Mandatory |
| GBP-Denominated Benchmarks | Valid performance comparison (e.g., vs FTSE 100) | S&P 500 as primary benchmark | Mandatory |
| FX Cost Tracking | Accounts for GBP-USD conversion fees in returns | Not supported | Mandatory |


