
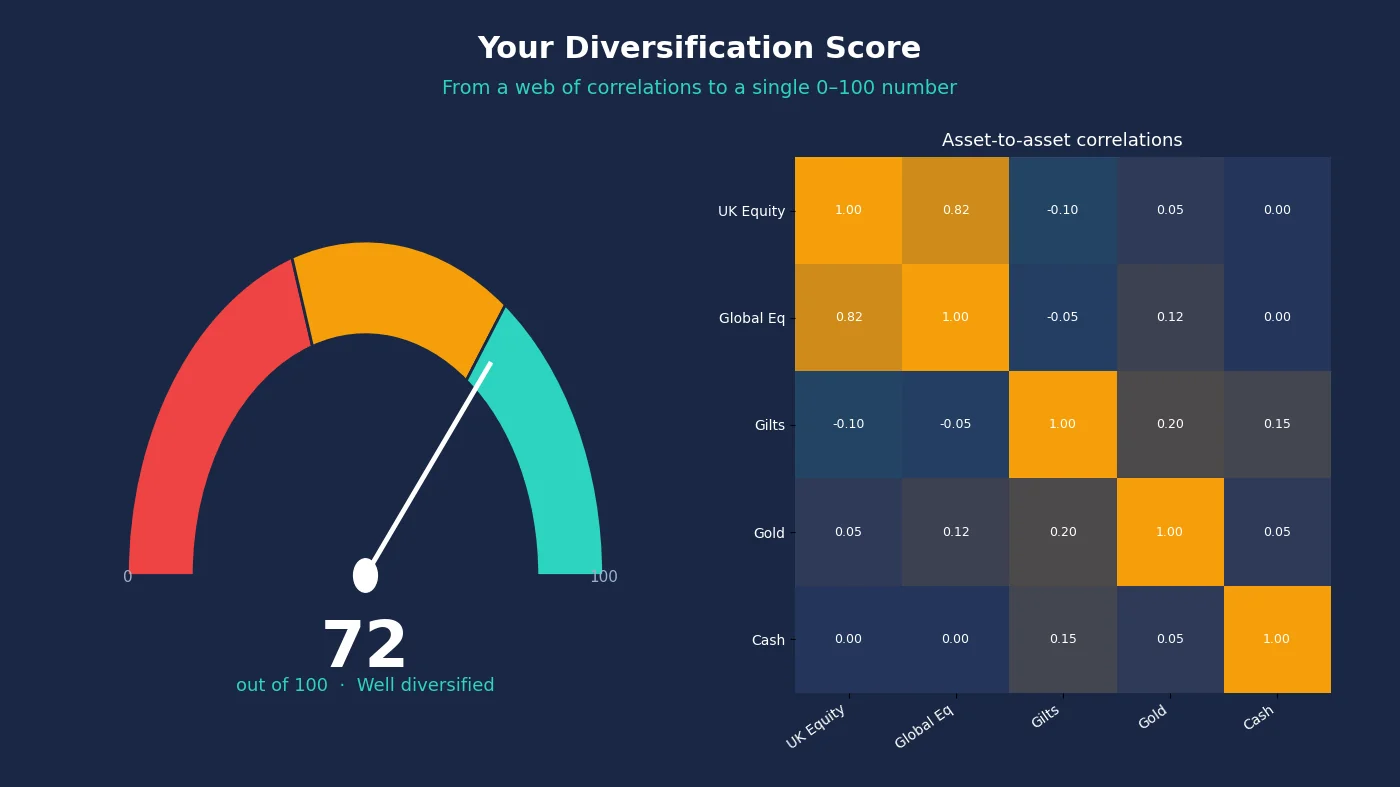
Meet Sarah, a UK investor who carefully spread her savings across 20 different funds — only to watch her portfolio plummet nearly as much as the FTSE 100 during the 2020 crash. Her apparent diversification failed when it mattered most. This scenario highlights a crucial blind spot: true diversification isn't just about holding many assets; it's about how those assets behave together when markets collapse. Your hard-earned capital faces significant, unexpected risk if underlying correlations surge during crises, turning a seemingly varied portfolio into concentrated exposure. This article explains how a Portfolio Diversification Calculator moves beyond simple asset counts. You'll learn how it stress-tests your holdings, revealing whether your 'diverse' investments dangerously converge into a single risk profile precisely when you need protection. Discover if your safety net is stronger than it looks — or poised to shatter.
Intuition
Imagine you've carefully spread your investments across 20 different stocks. On paper, that looks diversified — but what if they're all tech companies? When the tech sector crashes, your entire portfolio could plunge together. This illustrates the core insight: true diversification isn't just about how many assets you hold, but how they interact when markets collapse.
Many investors mistake quantity for resilience. It is common to hold individual stocks concentrated in familiar sectors, and to lean defensively on cash — a move that may overlook how cash drags down long-term growth. These approaches ignore a critical reality: during crises like 2008 or 2020, even seemingly unrelated assets (e.g., stocks and corporate bonds) suddenly move in lockstep. Correlations converge, erasing diversification benefits precisely when you need them most.
This is where a Portfolio Diversification Calculator transforms intuition into insight. Instead of just tallying assets, it stress-tests your portfolio against historical meltdowns. It calculates your diversification ratio — a metric revealing whether your holdings genuinely reduce risk or merely create an illusion of safety. For example, a portfolio with UK shares, government bonds, and gold might appear reliable. But if a calculator simulates a 2020-style crash and shows all three nosediving simultaneously, you’ve uncovered hidden fragility.
Your asset allocation strategy — the blueprint dividing investments across stocks, bonds, and cash — must account for these correlation landmines. A 60/40 stock/bond split might seem prudent, but if rising inflation hammers both (as in 2022), your "balanced" portfolio becomes a double liability. Similarly, rebalancing (adjusting weights to maintain targets) can backfire if done mechanically. Selling assets during a crash to buy others might trigger capital gains tax — with rates of 18% or 24% above the £3,000 annual exemption — while chasing assets that just crashed.
The calculator’s diversification isn’t static; it’s a dynamic shield that cracks under pressure if correlations spike. Think of it as a seatbelt tested not for smooth roads, but for head-on collisions. For deeper context, explore how Nobel-winning research in Markowitz Portfolio Optimisation quantifies this balance, or use our Correlation Calculator to see how assets move together.
The "aha" moment? Diversification only works if your assets don’t panic as one. A calculator exposes this invisible risk — turning a simple checkup into a survival audit. Pair it with tools like our Sharpe Ratio Explained guide to measure risk-adjusted returns, or browse our full suite of Free Tools to refine your strategy. ARIA PM automates correlation stress-testing and cost impact analysis, letting you focus on decisions — not data wrestling.
Mathematical Foundation
The true measure of diversification isn't how many assets you hold, but how their price movements interact — especially when markets collapse. During crises, assets that normally move independently often synchronise, erasing perceived safety nets. This section reveals the mathematics behind this hidden fragility, starting with correlation dynamics and culminating in crisis-driven risk quantification.
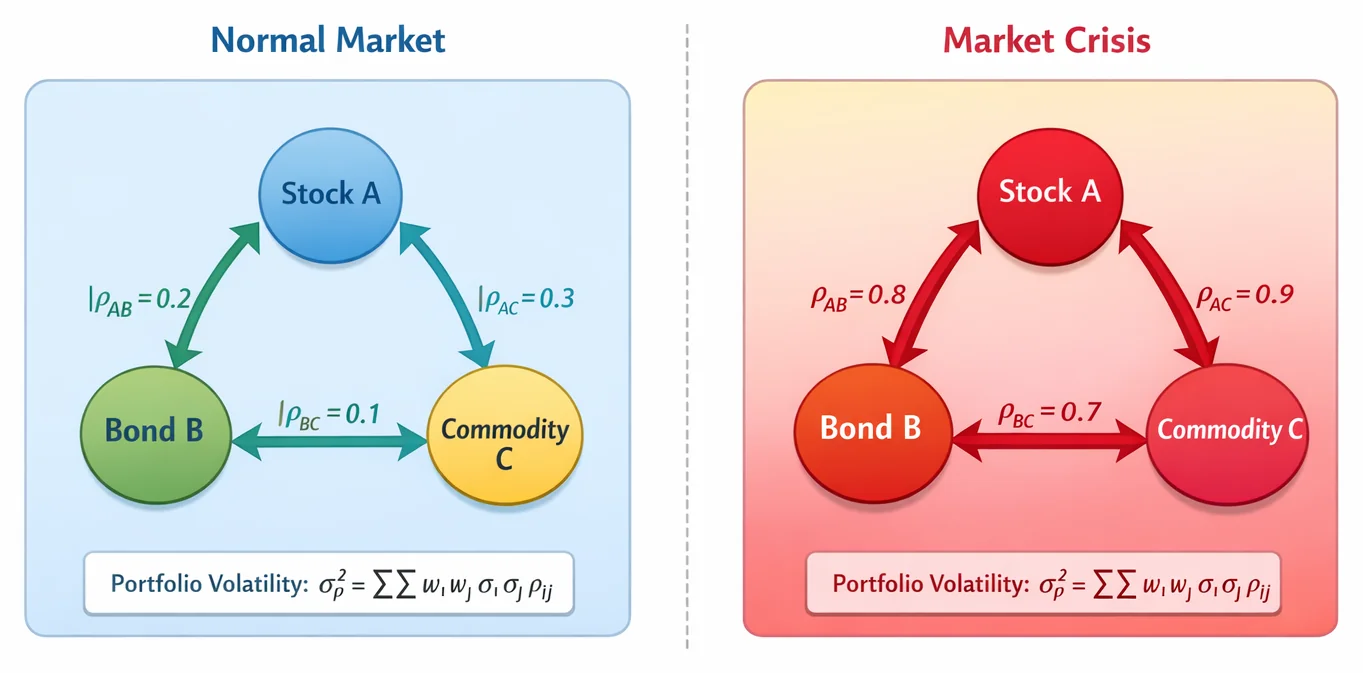
First, we define correlation analysis — the study of how investment returns move together. The correlation coefficient $\rho_{ij}$ between assets $i$ and $j$ ranges from $-1$ (perfect opposite movement) to $1$ (perfect synchronisation). A diversified portfolio requires low or negative correlations to mitigate risk. However, during market stress — like the 2008 crash or 2020 pandemic — correlations often spike toward 1, concentrating risk unexpectedly.
Portfolio risk is quantified through variance ($\sigma_p^2$), which depends critically on correlations. For a two-asset portfolio:
$$\sigma_p^2 = w_1^2 \sigma_1^2 + w_2^2 \sigma_2^2 + 2 w_1 w_2 \rho_{12} \sigma_1 \sigma_2$$
What this means is:
- $w_1, w_2$ are asset weights (e.g., 0.6 and 0.4 if 60% and 40% allocated),
- $\sigma_1, \sigma_2$ are individual volatilities (standard deviations of returns),
- $\rho_{12}$ is the correlation coefficient. In other words, this says that portfolio risk isn't just an average of individual risks — it's amplified when correlations rise. For example:
- In normal times ($\rho_{12} = 0.3$), a £100,000 portfolio split equally between two assets ($\sigma_1 = \sigma_2 = 15%$) has $\sigma_p \approx 12.2%$.
- During a crisis ($\rho_{12} = 0.9$), volatility surges to $\sigma_p \approx 14.5%$ — a 19% risk increase despite unchanged allocations.
For $n$ assets, the formula extends to:
$$\sigma_p^2 = \sum_{i=1}^n \sum_{j=1}^n w_i w_j \sigma_i \sigma_j \rho_{ij}$$
What this means is every pairwise correlation impacts overall risk. In other words, this says that "diversification" evaporates if all $\rho_{ij}$ approach 1 during stress — turning 20 uncorrelated assets into effectively one.
This brings us to Value at Risk (VaR), estimating worst-case loss over a period at a confidence level (e.g., 95%). Assuming normally distributed returns:
$$\text{VaR} = V \times z_{\alpha} \times \sigma_p \times \sqrt{t}$$
What this means is:
- $V$ is portfolio value (e.g., £100,000),
- $z_{\alpha}$ is the z-score (1.645 for 95% confidence),
- $\sigma_p$ is annualised portfolio volatility,
- $t$ is time horizon in years. In other words, this says that a £100,000 portfolio with $\sigma_p = 12.2%$ has a one-month 95% VaR of -£5,900. But if stress spikes $\sigma_p$ to 14.5%, VaR plunges to -£7,000 — exposing an extra £1,100 risk.
Practically, this mathematics reveals why investors who only rebalance after major market moves — or who never do — risk catastrophic losses: their "diversified" portfolios silently concentrate when correlations converge. A diversification calculator simulates these crisis dynamics, transforming static asset counts into a stress-tested shield. After all, true diversification isn't held — it's vigilantly maintained.
Implementation from Scratch
Building a portfolio diversification calculator requires translating financial theory into practical steps. We'll focus on two core metrics: standard deviation (measuring overall portfolio volatility) and effective asset count (revealing your true diversification depth). The goal isn't just to tally assets — it's to simulate how your portfolio behaves when markets unravel.
Step 1: Inputs and Setup
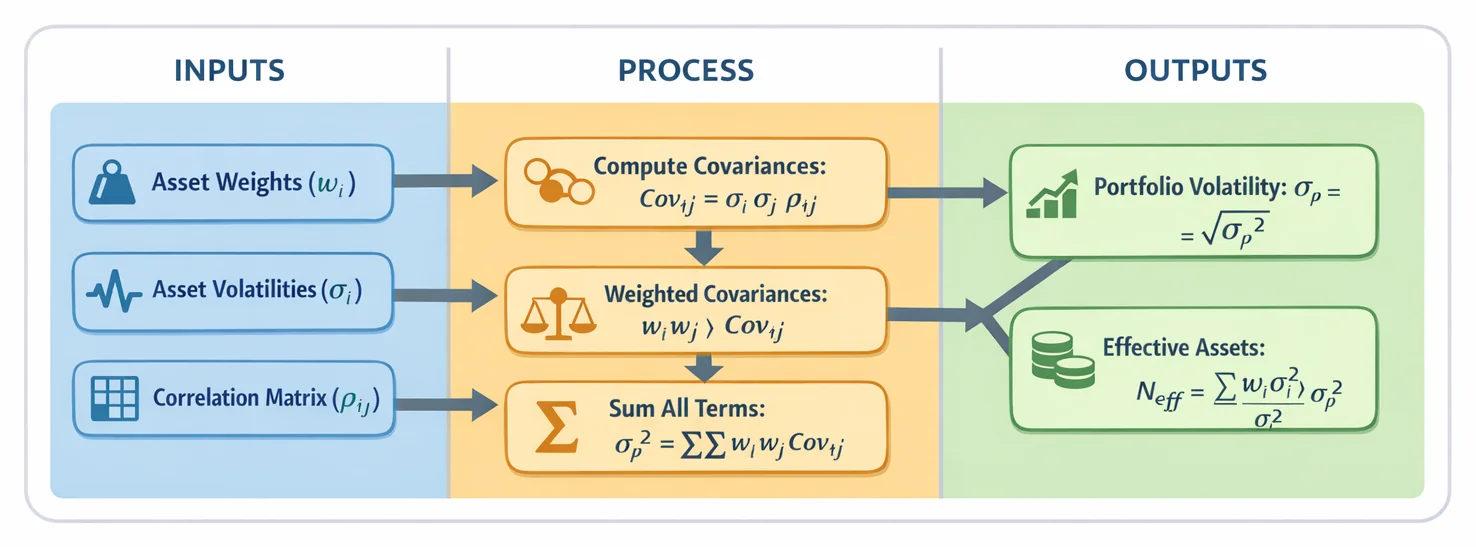
Start with your portfolio’s asset weights (e.g., 60% stocks, 30% bonds, 10% gold) and a covariance matrix derived from historical returns. This matrix captures how assets move together — critical for spotting hidden correlations. For stress-testing, you’d replace normal-period data with crisis-era figures (e.g., 2008 or 2020 correlations). Tools like our Correlation Calculator simplify this step.
Step 2: Calculate Portfolio Volatility
Portfolio standard deviation quantifies risk. It’s computed as:
- Multiply each asset’s weight by every other asset’s weight.
- Multiply those pairs by their respective covariances (from the matrix).
- Sum all results and take the square root.
For example, a portfolio with 12.1% volatility implies returns could swing by that amount annually. Higher volatility signals greater risk — especially if concentrated in one sector.
Step 3: Compute Effective Asset Count
This metric answers: "How many truly independent bets exist in my portfolio?" It’s calculated as:
- Multiply each asset’s weight by its individual volatility.
- Sum these values and square the result.
- Divide this by the portfolio’s variance (standard deviation squared).
A portfolio holding 20 stocks might have an effective asset count of just 5 during a crisis — meaning correlations have collapsed its diversification to the equivalent of five uncorrelated assets.
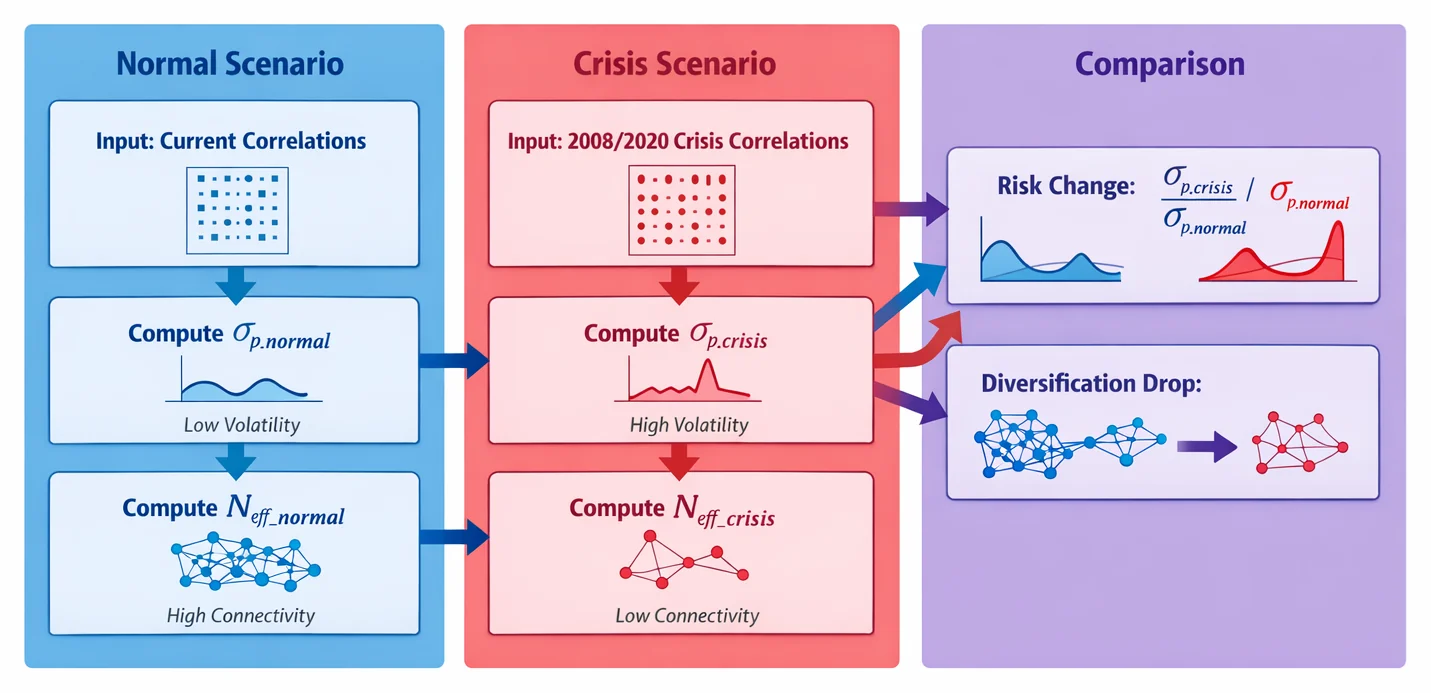
Step 4: Stress-Test with Crisis Correlations
Here’s where the calculator reveals fragility:
- Normal scenario: Use current correlations. A tech-heavy portfolio might show high effective asset count.
- Crisis scenario: Apply correlations from historical meltdowns (e.g., 2020’s market crash). Suddenly, that "diverse" tech portfolio could see its effective asset count plummet as stocks move in lockstep.
For instance, while many investors expect technology and AI to lead future growth, a crisis could turn this sector bet into a vulnerability.
Why This Matters
Diversification isn’t static. A portfolio boasting 20 assets might appear reliable — until stress-testing exposes its effective asset count crashing to 3 during turbulence. This convergence amplifies losses precisely when you need protection. Tools like the Sharpe Ratio help contextualise this risk-adjusted, but diversification metrics spotlight structural weaknesses.
For deeper theory, see our guide to Markowitz Portfolio Optimisation. Or explore our full suite of Free Tools to automate these calculations — because true diversification isn’t about asset count, but how they collectively weather storms.
Visualising the Results
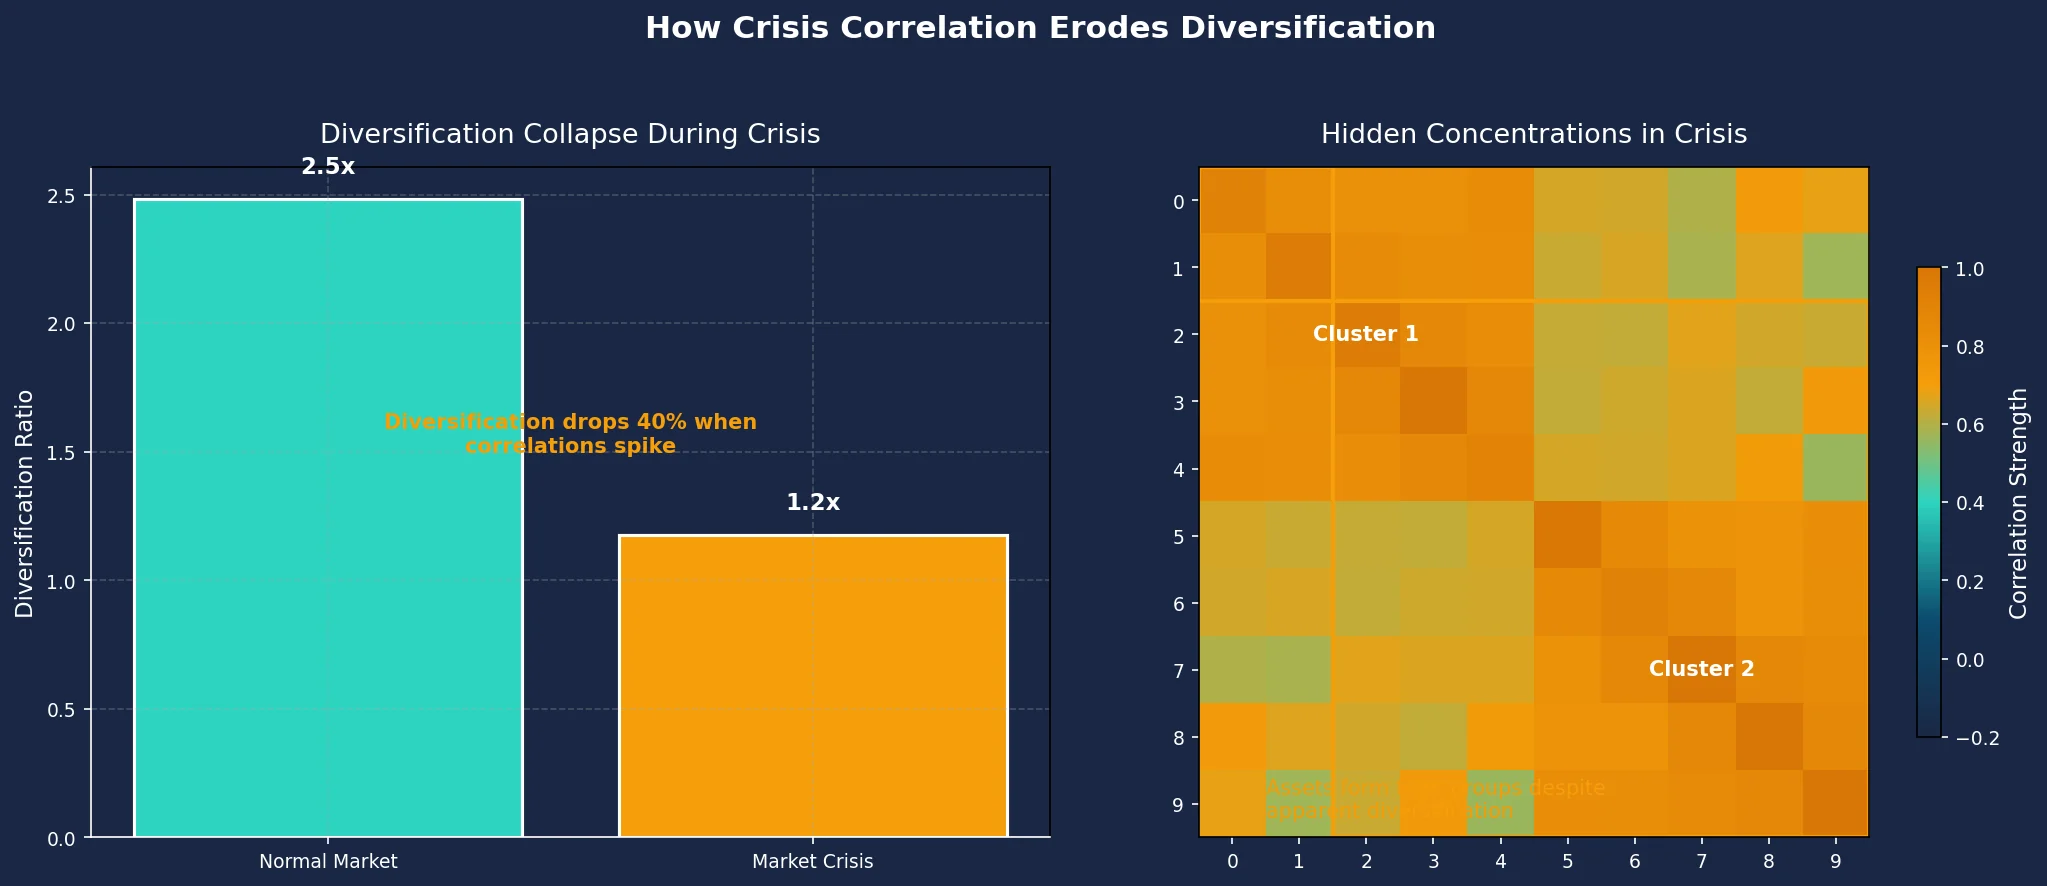
The Portfolio Diversification Calculator doesn't just tally your assets — it stress-tests them against market turmoil. The charts below reveal how your portfolio's apparent diversity can vanish when correlations spike. On the left, the diversification ratio plummets during a simulated crisis, showing your portfolio's volatility surges as assets move in lockstep. On the right, clustered correlations expose hidden concentrations: assets you thought were diverse form tight groups, leaving you exposed when markets fall. Look for a sharp drop in the diversification ratio and large blocks of high correlation (amber) in the heatmap — these signal fragility when you need protection most.
The Key Insight
The common belief that holding a wide array of assets guarantees true diversification is dangerously incomplete. Your portfolio might look spread across 20 stocks, five funds, and a bond — but if these assets move in lockstep during a market crash, your carefully constructed safety net evaporates precisely when you need it most. This is the hidden fragility the Portfolio Diversification Calculator exposes: it stress-tests how correlations — the tendency of assets to rise or fall together — converge violently during crises, turning apparent diversity into concentrated risk.
Consider 2008 or 2020. Stocks globally plummeted in unison, bonds faltered, and even "diverse" portfolios suffered catastrophic losses. Why? Because in calm markets, assets might seem uncorrelated, but under stress, correlations spike as panic spreads. A calculator that merely counts assets or sectors misses this entirely. Instead, ours uses Monte Carlo Simulation — modelling thousands of potential market scenarios, including historical crises — to reveal how your holdings might actually behave when the economy fractures. For example, it might show that your allocation to UK equities (holding 20-30% of the equity sleeve internationally is a common way to reduce home-country concentration) still leaves you overexposed if global recessions drag down all developed markets simultaneously.
This is where alternative investments — like real estate or commodities — prove critical. Their returns often behave differently from stocks and bonds during downturns, acting as genuine shock absorbers. The calculator evaluates whether your gold ETF or property fund truly offsets equity risk or merely adds expensive decoration. If your alternatives still correlate tightly with the FTSE 100 in simulated crashes, you’ve gained complexity, not resilience.
The insight isn’t just theoretical. Common guidance suggests even conservative portfolios keep a meaningful equity allocation for growth, with part of that equity sleeve held internationally. But without testing how correlation dynamics shift in crises, these allocations could backfire. Our tool quantifies this via the diversification ratio — a metric revealing whether your "spread" is robust or illusory under stress.
For UK investors, tax efficiency further complicates diversification. Holding assets in an ISA (with its £20,000 annual allowance) shelters gains and dividends from Capital Gains Tax and dividend levies. But if your ISA is filled with highly correlated UK stocks, you’ve traded tax efficiency for hidden risk. The calculator helps spot these trade-offs, ensuring tax strategy doesn’t undermine your safety net.
Ultimately, true diversification isn’t about owning many assets — it’s about owning assets that don’t fail together. By simulating how your portfolio behaves when correlations explode, this tool transforms from a static snapshot into a dynamic crisis detector. Pair it with our Correlation Calculator to scrutinise asset relationships, or explore Markowitz Portfolio Optimisation to balance risk and return mathematically. For long-term planning, combine it with our Compound Interest Calculator to see how correlation-driven losses compound over decades.
Diversification isn’t a checkbox; it’s a shield that must withstand storms. This calculator shows whether yours will hold — or shatter.
Explore more free tools to refine your strategy, or learn how risk-adjusted returns work in our guide to the Sharpe Ratio.
Comparative Visualisation
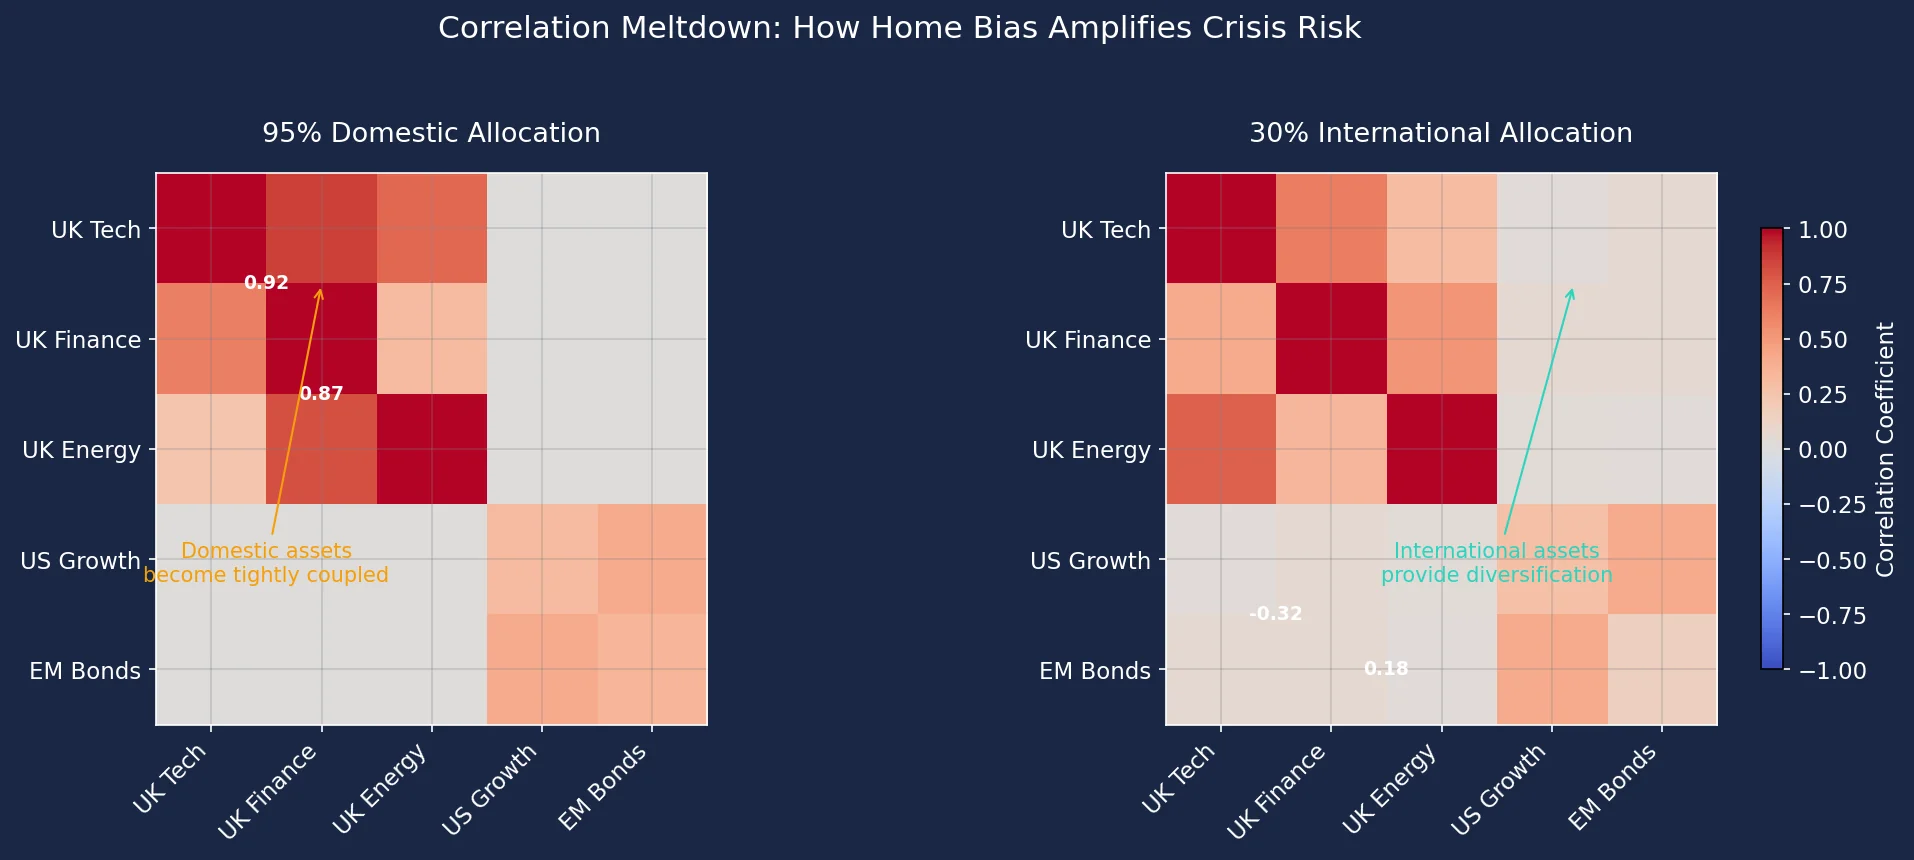
This visualisation reveals a critical blind spot: even portfolios with multiple holdings can become dangerously synchronised during market turmoil. We simulate two portfolios during a crisis — one heavily concentrated in domestic stocks, the other diversified globally — to expose how correlation patterns shift. Notice how the home-biased portfolio (left) becomes a sea of amber high-correlation clusters, meaning all assets move in lockstep when markets crash. In contrast, the globally allocated portfolio (right) maintains pockets of teal (low/negative correlation), acting as shock absorbers. This divergence proves true diversification isn't about asset count, but how holdings interact under stress.
Deep Dive Visualisation
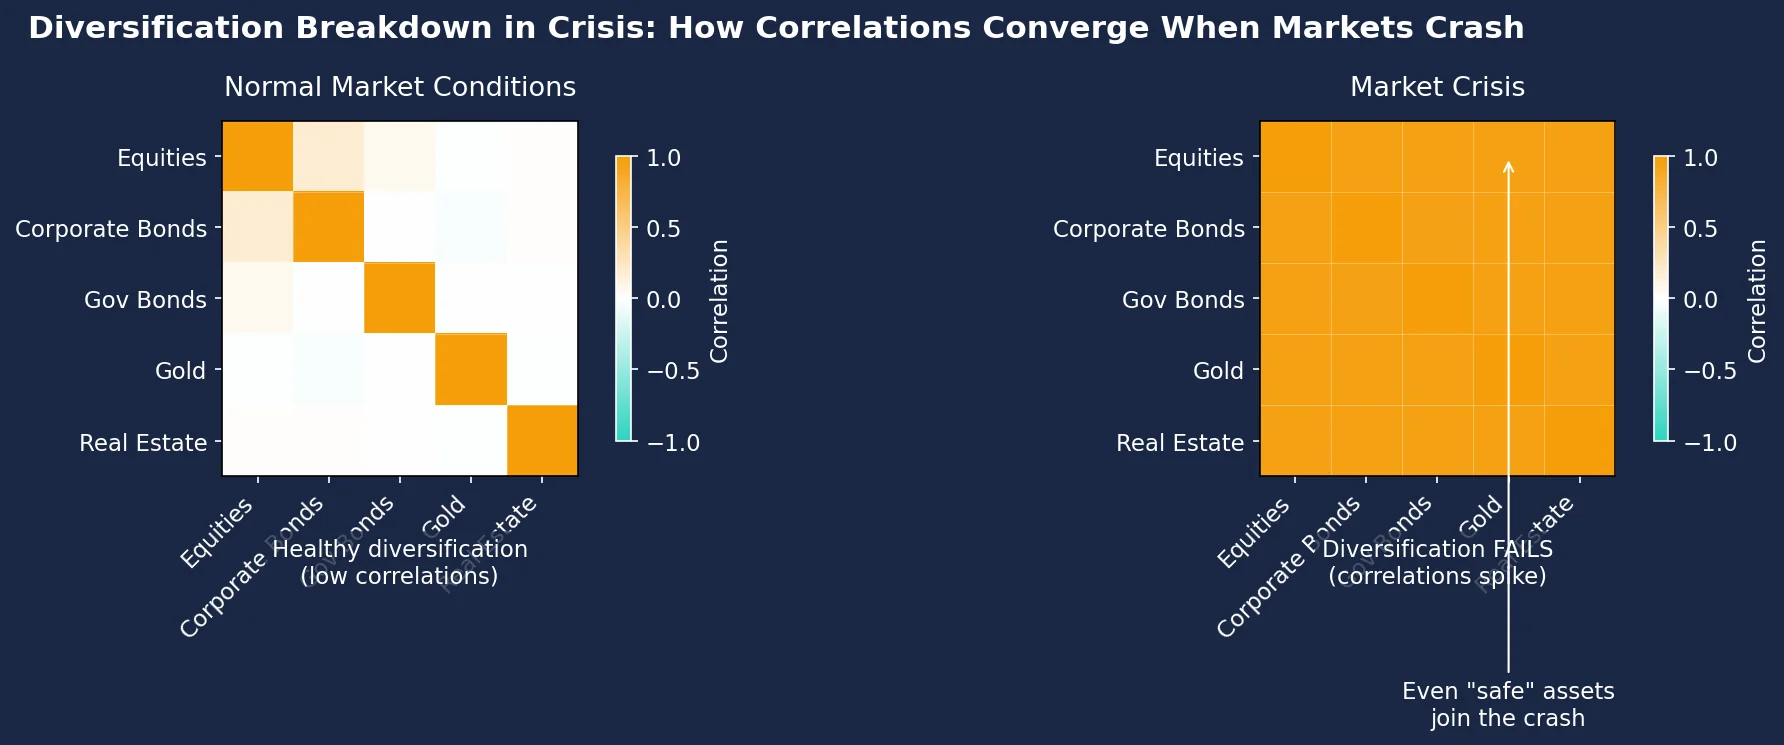
This side-by-side heatmap reveals the hidden danger in your portfolio: assets that appear diversified in calm markets (left) often move in lockstep during crises (right). The left chart shows healthy, low correlations between assets in normal times — suggesting strong diversification. But the right chart exposes the harsh reality: when markets crash, correlations spike across the board (amber zones), turning your carefully constructed portfolio into a single, highly correlated bloc. Look for the shift from blue/teal (low correlation) to amber (high correlation) in the right panel — especially among assets you thought were unrelated — as this is where your diversification shield shatters.
Key Takeaways
- Use the diversification calculator to stress-test how your portfolio's assets dangerously move together during historical market crashes like 2008 or 2020, revealing hidden fragility.
- Realise that holding many assets, especially within the same sector like technology, offers false security if their values collapse simultaneously in a crisis.
- Check if your portfolio's diversification ratio weakens significantly under simulated stress scenarios, indicating concentrated risk despite apparent spread.
- Question whether your cash allocation, while defensive, might hinder long-term growth without providing true crisis protection when correlations spike.
- Avoid purely mechanical rebalancing; selling assets during crashes to buy others might lock in losses if correlations mean they fall together.
| Feature | What It Does | Why It Matters |
|---|---|---|
| Standard Deviation | Measures overall portfolio volatility (price fluctuations) | Quantifies total risk but misses correlation dangers during market stress |
| Effective Asset Count | Calculates true independent exposures after accounting for correlations | Reveals if your "20 assets" are effectively 2-3 during crises due to synchronised moves |
| Crisis Simulation | Stress-tests correlations using historical crash data (e.g., 2008-2020) | Shows how your diversification collapses when markets tumble — exposing hidden fragility |
| Diversification Ratio | Compares portfolio volatility to average asset volatility | Values >1 indicate diversification benefit; ratios crashing below 1 signal failure |
| Correlation Heatmaps | Visualises pairwise asset correlations in calm vs. crisis markets | Identifies assets that become dangerously linked during turmoil (e.g., tech stocks in 2022) |
Comparing Diversification Assessment Methods
| Method | Captures Correlation Risk? | Stress-Tested for Crises? | Ease of Use | Real-World Accuracy |
|---|---|---|---|---|
| Simple Asset Count | No | No | High | Low (ignores sector/region overlaps) |
| Sector/Industry Checks | Partial | No | Medium | Medium (misses cross-sector links) |
| Portfolio Standard Deviation | Indirectly only | No | Medium | Medium (hides correlation spikes) |
| Portfolio Diversification Calculator | Yes | Yes | Medium | High (models crisis behaviour) |
Sources
- SEC: Beginners' Guide to Asset Allocation, Diversification, and Rebalancing — SEC's introduction to diversification principles and strategies for reducing investment risk.
- FCA InvestSmart: Risk and returns — FCA guidance on managing investment risks, including diversification as a core mitigation technique.
- Investopedia: Diversification — Explainer on diversification principles and how to assess asset-class balance in a portfolio.
- Morningstar Portfolio X-Ray — Analysis tool for assessing portfolio diversification across sectors, regions, and asset classes.
- Vanguard: How to analyse portfolio performance — Vanguard's guide to evaluating diversification, asset allocation, and portfolio balance.