
You've found two UK funds with similar returns, but one feels riskier. Or perhaps your overseas investments surged, only to lose gains to currency swings. How do you truly compare performance when risk and hidden costs differ? Misjudging this could mean accepting lower real returns than you realise or taking on more volatility than your savings plan can handle. This guide to Sharpe Ratio Explained cuts through the noise. We'll show you why this popular risk-adjusted measure isn't a one-size-fits-all number for UK investors. You'll learn how correctly using the local risk-free rate, understanding tax implications, and accounting for currency volatility transforms the Sharpe Ratio from a basic formula into a powerful, personalised tool for smarter portfolio decisions. No prior expertise needed.
What the Sharpe Ratio Is and Why It Matters for Your UK Portfolio
Imagine two UK investments: Investment A, a diversified FTSE 100 tracker, delivers a 7% annual return with steady, predictable growth. Investment B, a speculative biotech stock, also returns 7% but with stomach-churning 40% price swings. On paper, they appear equal-but which would you genuinely prefer? This is where the Sharpe Ratio transforms from abstract math to your portfolio’s essential "risk translator."
Simply put, the Sharpe Ratio measures how much extra return you earn per unit of risk taken. It’s calculated by subtracting the risk-free rate (like UK gilts) from your investment’s return, then dividing by its volatility (standard deviation). Crucially, it’s not about raw returns-it’s about efficiency. A high Sharpe Ratio means you’re getting more reward for every pound of risk endured. For UK investors, this matters for three key reasons:
- It exposes deceptive returns: A high-return asset might be dangerously volatile. The Sharpe Ratio reveals whether those gains compensate for the rollercoaster ride. Research shows how dramatically context changes: the S&P 500’s Sharpe Ratio swung from -0.65 (poor) to 3.0 (outstanding) in recent years-identical returns would mask vastly different risk experiences.
- It enables fair comparisons: When choosing between funds or ETFs, raw returns are misleading. A global equity fund and a UK corporate bond ETF might have similar returns, but wildly different risk profiles. The Sharpe Ratio levels the playing field, letting you compare apples-to-apples on risk efficiency.
- It aligns with regulatory priorities: The FCA’s Consumer Duty requires firms to communicate risks clearly. Understanding the Sharpe Ratio empowers you to scrutinise claims and demand transparency about risk-adjusted performance, not just headline returns.
Risk-adjusted returns-the core concept here-mean judging performance relative to the risk incurred. Standard benchmarks help interpret your ratio: 1.00-1.99 is good, 2.00-2.99 is very good, and 3.00+ is outstanding. For context, a portfolio ranking in the top 88% for risk/return efficiency (like one recently analysed) typically reflects a strong Sharpe Ratio.
But here’s the UK twist: the ratio is meaningless without accurate local inputs. Using a generic "risk-free rate" (like US Treasuries) distorts results-you must use current UK gilt yields. Currency volatility (e.g., holding USD assets) and post-tax returns further skew calculations. This makes the Sharpe Ratio a dynamic, personalised tool, not a static number.
Think of it as your portfolio’s "efficiency auditor." It helps you avoid overpaying for risk, identify genuinely skilled fund managers, and build resilient portfolios. Tools like our Portfolio Optimisation engine incorporate UK-specific factors automatically, while backtesting lets you stress-test strategies against historical crises. For deeper theory, our plain English guide to Markowitz Portfolio Optimisation explores its foundations.
Ultimately, the Sharpe Ratio translates volatility into insight. In a market where identical returns can hide vastly different risks, it’s your compass for smarter, calmer investing-turning raw numbers into actionable wisdom for your UK journey.
Breaking Down the Sharpe Ratio: A UK Investor's Step-by-Step Guide
Think of the Sharpe Ratio as a "reward-per-unit-of-pain" scorecard. It doesn't just measure raw returns-it reveals how efficiently your investments generate profit relative to the stomach-churning volatility you endure. For UK investors, its true power emerges only when we tailor it to our financial landscape. Let's demystify its three core components using British references.
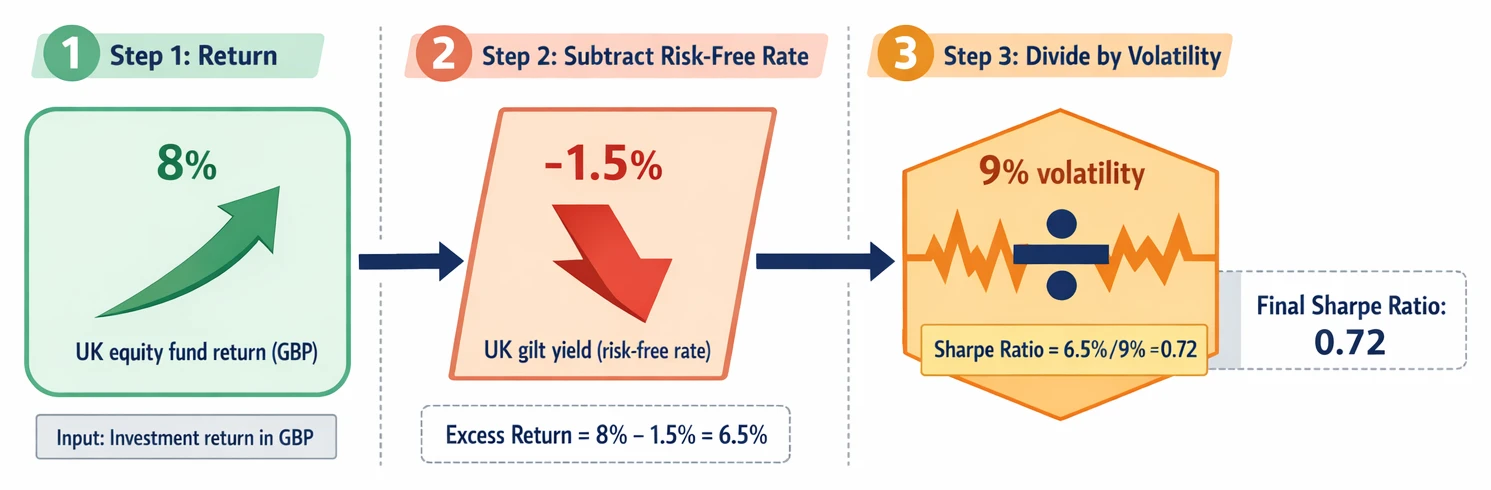
First, Return is your actual investment gain. Imagine your UK equity fund delivered 8% last year. That's the headline figure, but it doesn't account for what you could have earned risk-free. This brings us to the critical second input: the Risk-Free Rate. For UK investors, this isn't some abstract global rate-it's the yield on ultra-safe UK government debt, like 3-month gilts. As of 2025, this might be around 1.5%. Why subtract this? Because it represents your guaranteed alternative. If your fund only matched the gilt yield, you took unnecessary risk for zero extra gain. This subtraction-your excess return-is the real compensation for shouldering risk. Ignoring it (or using, say, US Treasury rates) distorts results for sterling-based portfolios.
Third, Volatility measures how wildly your investment swings in value. Picture the FTSE 100's jagged price chart versus a gilt's smooth line. Volatility (quantified as standard deviation) captures that bumpiness. Higher volatility means sharper peaks and deeper troughs-the emotional and financial "pain" of uncertainty. A fund with 9% volatility is inherently riskier than one with 5%, even if returns are identical.
Let's calculate with a hypothetical UK equity example:
- Your fund's return: 8%
- UK 3-month gilt yield (risk-free rate): 1.5%
- Fund volatility (standard deviation): 9%
First, find your excess return: 8% minus 1.5% = 6.5%. This is your reward for taking risk. Now divide by volatility: 6.5% ÷ 9% = 0.72. That's your Sharpe Ratio. This fund generated 0.72 units of excess return for every unit of volatility endured. In a recent analysis, a similar Sharpe Ratio placed a UK fund in the top 25% compared to the broad market for risk-adjusted efficiency.
Why does local context dominate? If you'd naively used a US Treasury rate (say, 2.5%), your excess return becomes 5.5%, and the Sharpe Ratio drops to 0.61-artificially penalising the fund. Currency fluctuations and UK tax treatments (like ISA wrappers shielding returns) further personalise this metric. As explored in our guide to Markowitz Portfolio Optimisation, accurately defining risk is foundational to portfolio construction.
Remember: Historical Sharpe Ratios vary across timeframes. A 1-year ratio might look stellar, while a 10-year view reveals mediocrity. Comparing to the S&P 500's Sharpe Ratio is tempting but misleading-US returns converted to sterling introduce currency risk unrelated to fund manager skill. Backtesting across market regimes using UK-specific data often provides deeper insight than any single ratio snapshot.
Ultimately, the Sharpe Ratio is dynamic. A "good" score depends on your gilt alternative at that moment and your personal risk capacity. Platforms like ARIA PM automate these UK-centric adjustments in their Risk Analytics Dashboard, letting you focus on strategy-not spreadsheet gymnastics. By mastering this tailored approach, you transform the Sharpe Ratio from a generic number into a precision tool for navigating the UK investment landscape.
Sharpe Ratios in the Wild: Real UK Examples and Tools
For UK investors, the Sharpe Ratio isn't a one-size-fits-all benchmark. Its true power lies in how you adapt it to your financial reality. Let’s examine real 2025-2026 data to see why context is everything.
Consider two popular ETFs: VanEck’s TDIV.AS (Sharpe 3.87) and Vanguard’s VTV (0.84). This staggering gap isn’t just about returns, it signals vastly different risk efficiency. The VanEck fund delivered nearly 4x more return per unit of risk than the Vanguard fund during this period. For a UK investor, this highlights why comparing similar assets using the Sharpe Ratio is crucial before committing capital. But remember: these figures are snapshots. As the S&P 500 demonstrated in 2025, swinging from -0.65 to 3.0 within months, market indices can resemble rollercoasters. This volatility underscores why rolling Sharpe Ratios (analysed over shifting time windows) often provide deeper insight than static numbers, revealing how performance stability changes with market conditions.
Individual stocks tell another story. Take Walmart’s 2025-2026 Sharpe of 5.04 versus iShares’ globally diversified IWDA.AS ETF (2.42). While Walmart’s ratio appears superior, it reflects concentrated risk. The ETF’s lower ratio represents the trade-off for diversification, a reminder that chasing headline Sharpe figures without understanding the underlying assets is dangerous. For UK-specific funds, risk-adjusted performance consistency matters most. Tools like Trustnet reports or Hargreaves Lansdown factsheets let you filter funds by Sharpe Ratios while emphasising UK gilts as the appropriate risk-free rate benchmark.
Here’s a critical pitfall: US-published ratios often default to Treasury bills. UK investors must mentally adjust these for current gilt yields. A US fund boasting a "high" Sharpe Ratio might look mediocre when evaluated against UK risk-free rates. Free tools like Morningstar help, but always verify which benchmark was used. For deeper analysis, our Portfolio Optimisation tool lets you customise risk-free rates and simulate adjustments.
Regulatory shifts also influence risk landscapes. The FCA’s April 2026 capital rules overhaul, slashing legal complexity by 70%, could impact fund operations and risk exposures. Pairing Sharpe analysis with historical backtesting helps stress-test strategies against such changes. And when evaluating funds, prioritise those ranking in the top percentiles for risk/return efficiency among UK peers, not just raw returns. ARIA PM automates this via its Risk Analytics Dashboard, integrating live gilt data and tax adjustments to personalise your Sharpe calculations. Because ultimately, this metric isn’t about chasing the highest number, it’s about calibrating risk to your financial ecosystem.
Critical UK-Specific Mistakes: Why Your Sharpe Ratio Might Be Wrong
While the Sharpe ratio is a powerful tool for UK investors, and formally recognised by the Financial Conduct Authority (FCA) as a standard performance metric, it’s dangerously easy to miscalculate or misinterpret in a UK context. Treating it as a universal, static benchmark ignores how deeply its accuracy depends on local market dynamics. Here are five critical mistakes and how to fix them:
1. Using US T-Bills Instead of UK Gilts for the "Risk-Free" Rate
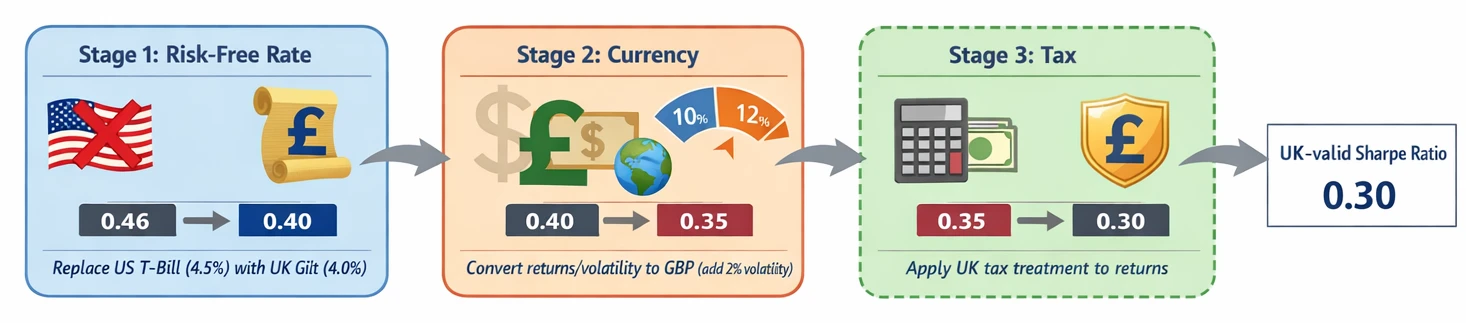
Mistake: Plugging in US Treasury bill rates (e.g., 4.5%) when UK 3-month gilts yield 4.0%. This seems minor but distorts your baseline. Why it matters: A 0.5% overstatement in the risk-free rate inflates the numerator (excess return). For a fund with 8% return and 10% volatility, this error boosts the Sharpe ratio by 15% (from 0.40 to 0.46). You’re comparing apples to oranges. Fix: Always use short-term UK gilt yields as your risk-free rate. The FCA’s CCI disclosure regime standardises this data, making it easily accessible.
2. Ignoring Currency Volatility in Foreign Holdings
Mistake: Evaluating a US S&P 500 ETF using its USD returns, ignoring GBP/USD swings. Why it matters: Currency risk amplifies volatility. A US ETF with a Sharpe ratio of 1.2 in USD terms might drop to 0.8 when returns are converted to GBP. For UK investors, this hidden volatility misrepresents true risk. Fix: Calculate returns and volatility in GBP. For UCITS ETFs (common in UK portfolios), this is non-negotiable. Tools like our Risk Analytics Dashboard automate currency-adjusted calculations.
3. Overlooking Tax Implications
Mistake: Using pre-tax returns for taxable accounts, especially with tax-advantaged assets like gilts (exempt from UK capital gains tax). Why it matters: Gilts’ post-tax returns are higher than equities for basic-rate taxpayers. A pre-tax Sharpe ratio of 0.7 for gilts might fall to 0.5 after tax, while an equity fund’s ratio drops less severely. This skews comparisons. Fix: Use after-tax returns for taxable holdings. Factor in dividend taxes, CGT, and gilt exemptions.
4. Comparing Different Time Periods
Mistake: Judging a fund’s 1-year Sharpe ratio (e.g., 1.8 during a bull market) against a competitor’s 5-year ratio (e.g., 1.2 including a recession). Why it matters: Short-term ratios capture noise, not strategy resilience. A 1-year "high" ratio could vanish in volatile markets. Fix: Compare identical timeframes. Use portfolio backtesting to simulate performance across cycles, like the 2020 crash or 2022 inflation spike, as explained in our guide to backtesting.
5. Treating "2.0" as Universally "Good"
Mistake: Assuming a Sharpe ratio of 2.0 is always stellar, ignoring context. Why it matters: In 2025, the S&P 500’s ratio hit 3.0 (exceptional), while Vanguard’s Value ETF (VTV) trailed at 0.84 (modest). A 2.0 UK equity fund might look strong against VTV but weak against the S&P 500 or a gilt ladder. Fix: Contextualise ratios against relevant benchmarks and the prevailing market "norm." This aligns with the FCA’s push for standardised, comparable risk data.
The Bottom Line
The Sharpe ratio isn’t plug-and-play. Its value lies in precise, UK-aware inputs: gilts for risk-free rates, GBP-denominated volatility, post-tax returns, and like-for-like timeframes. By sidestepping these pitfalls, you transform it from a vague number into a dynamic compass for your portfolio’s smarter risk-adjusted decisions. For deeper dives into balancing risk and return, explore Markowitz portfolio optimisation.
Putting Sharpe Ratios to Work: Your UK Investor Action Plan
Now that you understand the Sharpe Ratio’s mechanics, let’s translate theory into action. Remember: this isn’t a one-size-fits-all metric. Its real power for UK investors lies in customising it to your context-especially the risk-free rate, tax drag, and currency exposure. Here’s your 5-step plan:
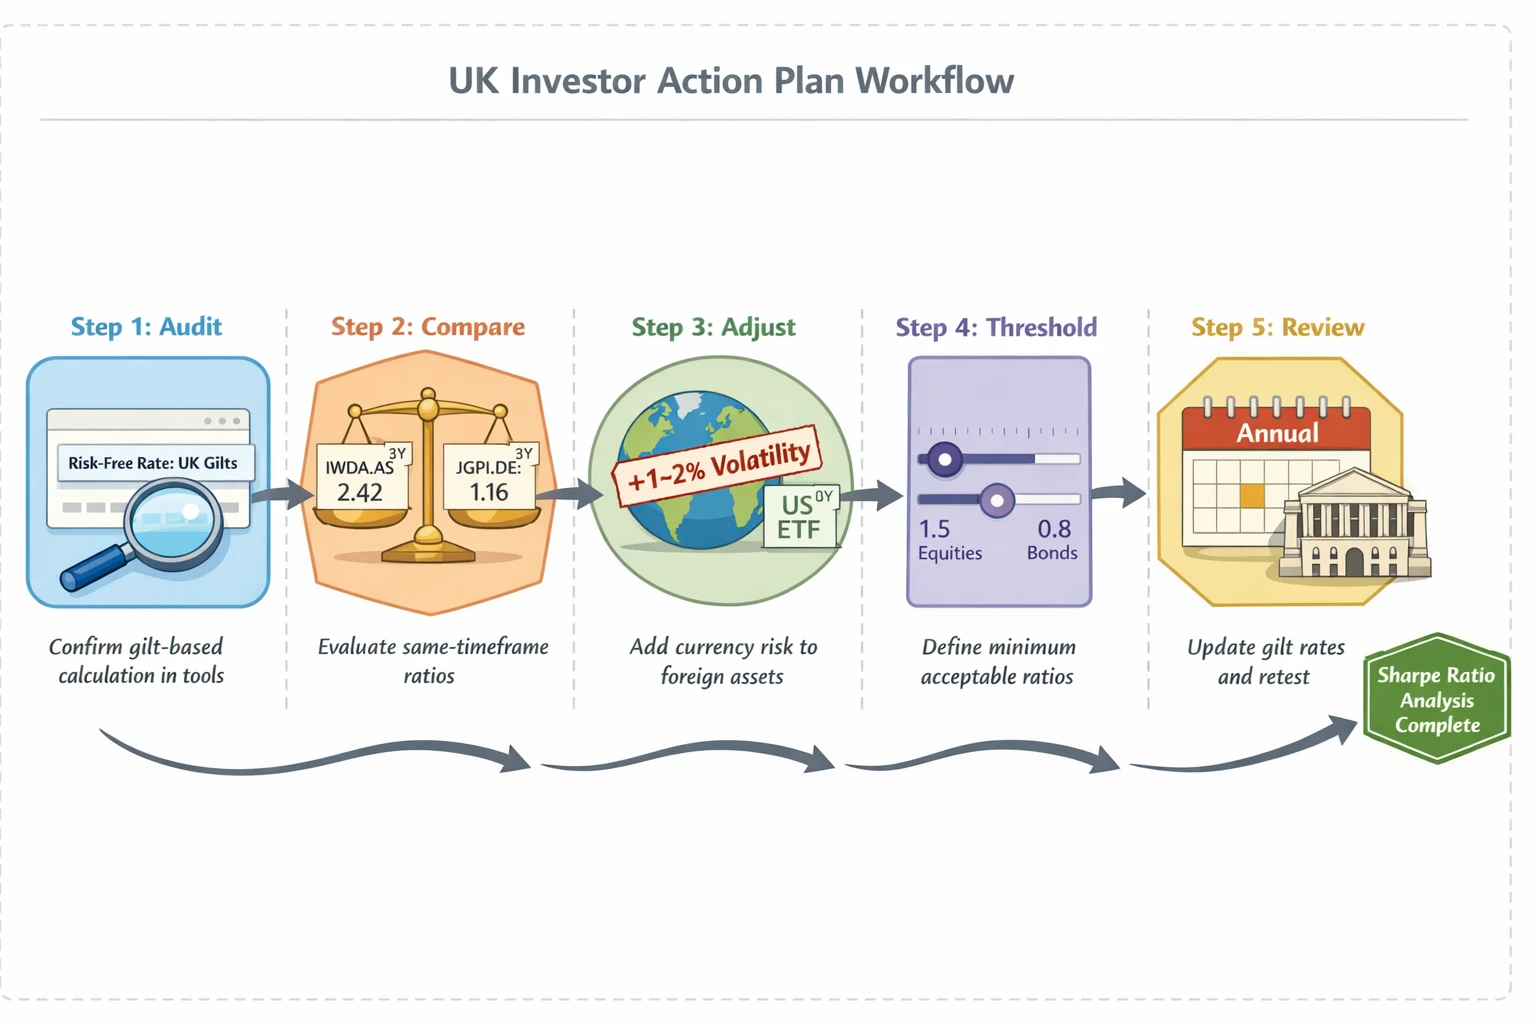
- Audit Your Holdings’ Calculations: Start with one investment. If you use platforms like Trustnet for Sharpe Ratios, verify which risk-free rate they use. Many default to US Treasury bills, but UK investors should benchmark against UK gilts. A fund showing a Sharpe of 1.2 with US rates might drop to 0.9 when using UK rates-drastically changing its risk-efficiency story.
- Compare Like-for-Like Funds: Use the ratio to filter similar options. Take two global equity ETFs: iShares Core MSCI World (IWDA.AS) reports a 3-year Sharpe of 2.42, while JPMorgan Global Growth (JGPI.DE) shows 1.16. This suggests IWDA delivered more return per unit of risk over that period. But always check the timeframe-time period variability means ratios shift across market cycles.
- Adjust for Currency Volatility: For international assets, add 1-2% to the reported volatility of returns. Why? A US stock’s "stable" 10% volatility could effectively be 12% for a GBP-based investor due to GBP/USD swings. This adjustment better reflects your real risk exposure.
- Set Personal Thresholds: Define your minimum acceptable Sharpe Ratio. For example: target >1.5 for equities, >0.8 for bonds. This anchors decisions to your risk tolerance. A high-yield bond fund with a 7% return and Sharpe of 0.6 might be inefficient versus an equity fund at 8% with a Sharpe of 1.8.
- Review Annually & Contextualise: Recalculate key ratios each year using updated UK gilt rates (find these on the Bank of England website). Pair Sharpe with other metrics-like maximum drawdown in our Risk Analytics Dashboard-to avoid over-reliance on one number.
Crucially: This is one tool in your kit. A high Sharpe Ratio doesn’t guarantee future results or account for extreme "black swan" events. Always align it with your overall strategy, tax situation (ISAs vs. taxable accounts), and goals. For sophisticated modelling-like stress-testing how your portfolio’s risk-efficiency holds up in different UK inflation regimes-ARIA PM handles survivorship adjustment, cost modelling, and regime stress-testing automatically. This lets you focus on interpreting results rather than building simulations.
Empowerment unlocked: You now see past raw returns to true risk efficiency. By tailoring the Sharpe Ratio to UK realities-the gilt-based risk-free rate, sterling volatility, and your personal thresholds-you transform it from an abstract formula into a dynamic compass for smarter portfolio decisions. For deeper dives into balancing risk and return, explore our guide to Markowitz Portfolio Optimisation.
Key Takeaways
- For UK investors, the Sharpe Ratio's true value lies not in the raw calculation but in accurately using the current UK gilt yield as the risk-free rate and adjusting for UK-specific factors like tax and currency risk.
- Always benchmark the risk-free rate component against current yields on UK government gilts (like the 3-month Treasury bill), not generic international rates, to reflect your actual opportunity cost.
- Factor in the impact of UK income tax and capital gains tax on your investment's net return before calculating its Sharpe Ratio for a true picture of your risk-adjusted gain.
- When assessing international funds, explicitly consider sterling (GBP) volatility alongside the fund's own volatility, as currency swings significantly impact the risk profile for a UK-based investor.
- Use your understanding of the Sharpe Ratio to scrutinise fund marketing under the FCA's Consumer Duty, demanding clear disclosure of risk-adjusted performance, not just headline returns.
| Option | Description | Why It Matters for UK Investors | Typical Rate (Illustrative 2025-2026) |
|---|---|---|---|
| UK 3-Month Treasury Bills | Short-term UK government debt, considered very low risk. | Directly reflects UK government credit risk and local market conditions. | ~0.5% - 1.5% |
| Bank of England Base Rate | Interest rate set by the BoE for commercial bank lending. | Influences savings rates across UK banks; signals monetary policy direction. | ~0.25% - 1.0% |
| Inflation-Linked Gilts | UK government bonds adjusted for inflation (e.g., RPI). | Provides "real" risk-free rate by accounting for UK inflation. | Real yield: ~-1% to 0.5% |
| High-Interest Savings Account | Cash deposits in UK-regulated banks (FSCS-protected). | Accessible retail option reflecting actual risk-free returns after UK bank risk. | ~0.1% - 2.0% (varies) |
Common Sharpe Ratio Pitfalls & UK-Specific Solutions
| Mistake | Why It Distorts Results | UK-Specific Correction |
|---|---|---|
| Using US T-bill rates | Ignores GBP/USD volatility and BoE/Fed policy divergence. | Use UK-specific benchmarks (e.g., BoE rate or UK gilts). |
| Ignoring tax drag | Pre-tax returns overstate net gains; UK CGT/dividend taxes reduce actual returns. | Calculate returns after 20% CGT and dividend tax (adjust for tax wrapper status). |
| Overlooking currency risk | Unhedged international assets add GBP volatility unrelated to asset performance. | Use currency-hedged returns or include GBP fluctuations in volatility calculations. |
| Misjudging inflation | Nominal returns with real risk-free rates (or vice versa) create inconsistent comparisons. | Match nominal returns with nominal risk-free rates, or consistently use real figures. |


