
Imagine Sarah, a UK retiree, watching her carefully built investment portfolio dip sharply during market turbulence. She thought diversification protected her, but hidden links between her assets amplified losses. This scenario highlights why a Portfolio Health Check is crucial — it's not about chasing returns, but uncovering hidden dependency risks. Traditional performance indicators can mask these vulnerabilities, becoming early warnings of potential fragility when viewed as a connected system. Ignoring this systemic risk puts your capital and long-term financial goals, like a secure retirement, in jeopardy. This article cuts through the complexity. You'll learn, in plain English, how to measure and score your portfolio's true health to identify these hidden dangers and build genuine resilience — no prior expertise needed.
What is a Portfolio Health Check? (And Why It's Not About Performance)
Think of your investment portfolio like your physical health: you wouldn't wait for chest pains to get a check-up. A portfolio health check works similarly. It’s a preventative assessment of your investments' structural resilience, not a report card on past returns. Crucially, it measures hidden dependency risks — the complex, often invisible links between your assets that can amplify losses during market stress. This is why your portfolio health score isn't about performance; it's a systemic risk gauge showing how vulnerable your wealth is to sudden shocks.
Investors are waking up to this need. A striking 78% of financial advisors report clients now proactively raising concerns about portfolio risk — a clear shift towards preventative thinking. Yet, traditional metrics like returns or volatility often miss the bigger picture. When viewed systemically, these become leading indicators of fragility. For example, irregular rebalancing frequency — where only 30% of investors have a set schedule — can silently concentrate risk. If your Stocks and Shares ISA drifts from 60% equities to 80% during a bull market (as 40% of investors only rebalance after major moves), you’re suddenly over-leveraged to a downturn. Meanwhile, nearly 20% never rebalance at all, letting portfolios grow increasingly unstable.
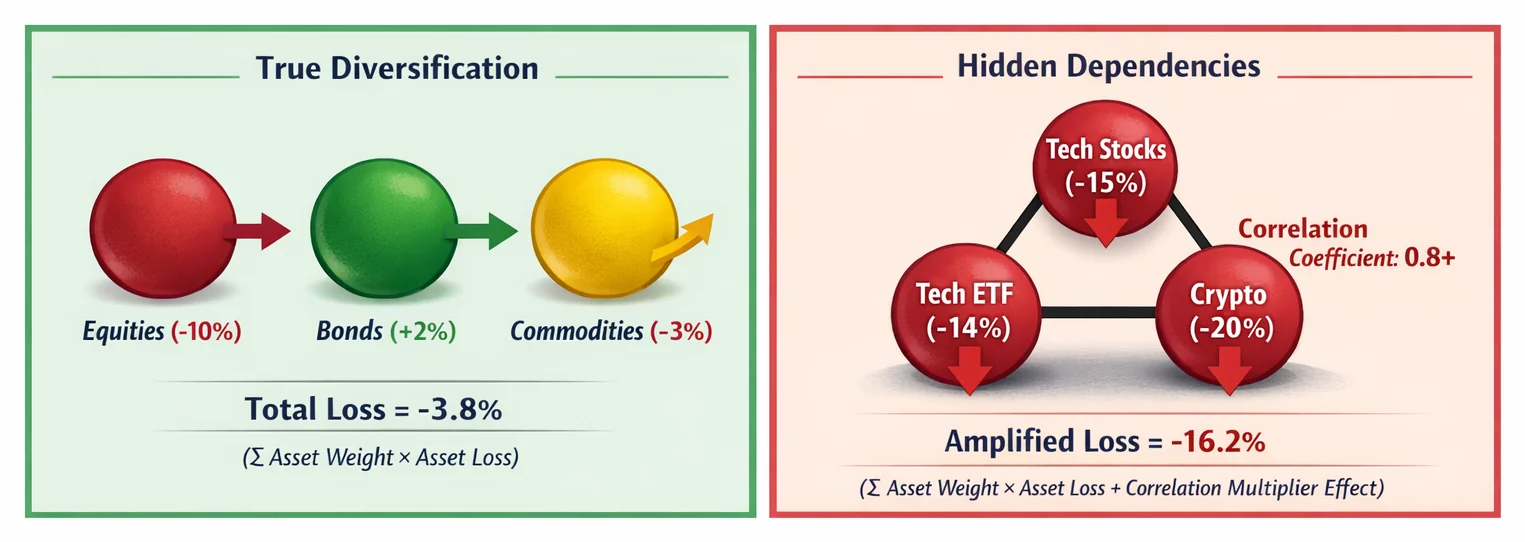
This systemic view reveals how hidden dependencies magnify danger. Imagine two funds in your SIPP both heavily invested in UK financial stocks. Individually, they seem diversified, but their high correlation means they’ll likely crash together in a banking crisis. Many investors overlook these interconnections, focusing solely on standalone performance. Tools like our Correlation Calculator help spot these invisible threads, while understanding concepts like Markowitz Portfolio Optimisation explains why diversification isn't just about number of assets, but how they interact.
A true health check examines these dynamics: how costs compound over time (try our Compound Interest Calculator to see how fees erode returns), whether allocations align with your risk tolerance, and how correlations might unravel in a crisis. It’s financial preventative care. Just as a medical scan spots blockages before a heart attack, a tool like our Portfolio Calculator identifies dependency risks before they cripple your wealth. ARIA PM automates this analysis — handling stress-testing and cost modelling so you can interpret risks, not build spreadsheets. Start treating your portfolio like your health: regular check-ups catch hidden problems early.
The Hidden Risks Your Portfolio Health Check Must Uncover
Your portfolio health score isn’t just a performance report card, it’s a forensic tool exposing hidden dependency risk. These are systemic weak points where seemingly solid investments become dominoes in a crash. Traditional metrics like returns or sector bets turn into leading indicators of fragility when viewed through this lens. Let’s dissect four critical risks amplifying losses during volatility, backed by alarming data.
First, concentration risk silently hijacks portfolios. A staggering 73% of retail investors are overexposed to technology stocks, with giants like the "Magnificent 7" now comprising 30% of the S&P 500. If you hold popular UK funds like the Vanguard S&P 500 UCITS ETF or L&G Global Technology Index Trust, you might unknowingly double down on this cluster. When tech stumbles, as it did in 2022’s 30% Nasdaq plunge, your entire portfolio could unravel.
Second, false diversification creates illusionary safety. Despite holding multiple assets, 89% of investors do not monitor portfolio correlation, meaning their "spread" of funds can behave identically in a crisis. For example, a UK-focused FTSE 100 ETF and a global equity fund may both nosedive during a recession — leaving you exposed to the very drawdown the diversification was meant to soften. Our Correlation Calculator helps spot these invisible links.
Third, equity overweighting has surged since 2015. Across 247 US endowments and foundations, average allocations to public and private equity rose from 51.7% in June 2015 to 64.8% in June 2025. This drift leaves portfolios hypersensitive to market swings: on a £100,000 pot, the 2015 mix would have put £51,700 in equities, while the 2025 mix puts £64,800 — meaning the same equity drawdown now bites roughly a quarter harder. Regular rebalancing via our Portfolio Calculator is crucial.
Fourth, alternative investment blind spots introduce wildcards. Over half of investors (55%) now hold at least one alternative asset like crypto, but few grasp their tiered risks. Conventional sizing caps crypto at 1-3% of holdings for conservative investors, 3-7% for moderate, and 5-10% for aggressive — beyond that, portfolio returns start mirroring speculative assets rather than tracking the underlying allocation.
These dependencies compound during stress: when equities fall, previously uncorrelated alternatives can move in lockstep with risk assets, accelerating losses. Meanwhile, 55% of investors plan to maintain or increase cash buffers in 2026 — wise, but insufficient against these structural risks.
As volatility looms, these hidden dependencies transform modest pullbacks into portfolio emergencies. Tools like ARIA PM automate survivorship bias checks and regime stress-testing, letting you diagnose risks before they metastasise. For deeper insights, explore Markowitz Portfolio Optimisation: Plain English to build truly resilient allocations.
Step-by-Step: How to Score Your Portfolio's Health in Plain English
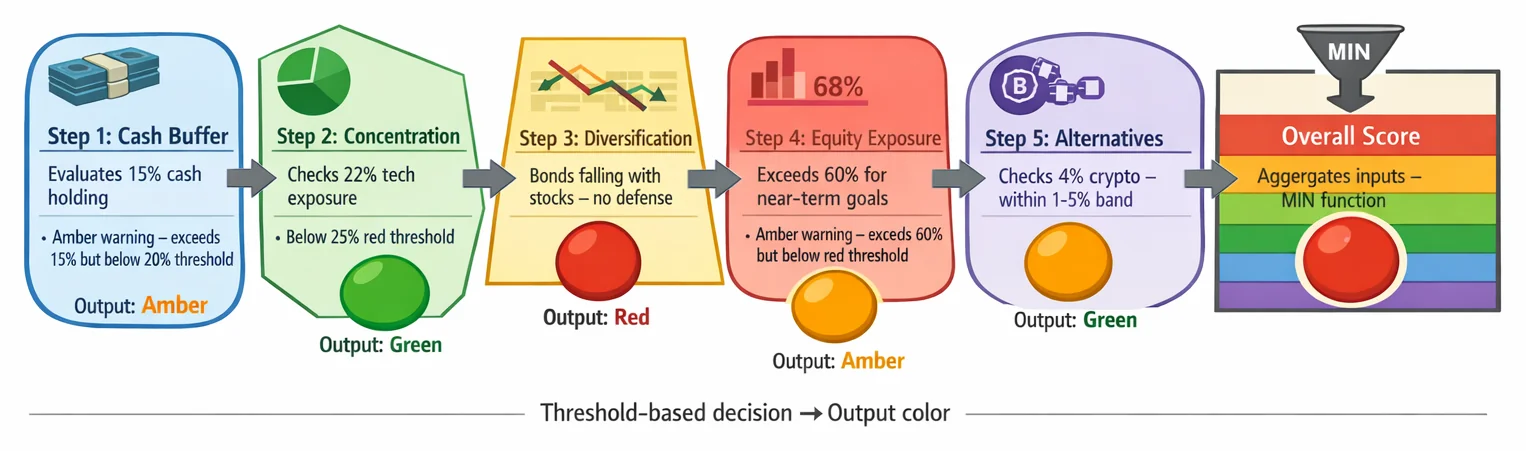
Forget complex ratios or chasing returns. Your portfolio’s real "health" hinges on hidden dependency risk, how vulnerable you are to domino effects during market chaos. Think of it like checking your car’s brakes: it’s about safety, not speed. Here’s a 5-step traffic-light system (red/amber/green) to spot trouble early, using free tools like Morningstar UK.
Step 1: Map EVERYTHING (Including Cash)
Start by listing every asset: stocks, bonds, funds, crypto, and crucially, cash. Why? Over half (55%) of UK investors now keep significant cash reserves, but idle cash erodes value through inflation. Use our free Portfolio Calculator to input holdings. Scoring:
- Green: Cash covers 3-6 months of expenses (emergency buffer).
- Amber: Cash exceeds 20% of your portfolio (opportunity cost).
- Red: No cash buffer (you’re forced to sell assets in downturns).
Step 2: Calculate Concentration Risk
A single stock or sector dominating your portfolio amplifies fragility.
- Single stock: If any holding exceeds 5% of your portfolio, it’s an amber warning. (Example: A £60,000 portfolio with £3,500 in one company).
- Sector exposure: If any sector (e.g., tech) tops 25%, it’s a red danger. Free tools like Morningstar’s X-Ray show sector breakdowns instantly.
Step 3: Test Diversification (The 2022 Stress Test)
Correlation monitoring is key: Do your assets move together in crises? Ask: “Did my bonds fall with stocks in 2022?” If yes (many did), your "diversification" failed. This hidden linkage is why 81% of advisors now add protection strategies. Scoring:
- Green: Bonds rose/stayed flat when stocks fell (true diversification).
- Amber: Bonds fell less than stocks (partial protection).
- Red: Bonds and stocks fell together (no defence). Check correlations with our Correlation Calculator or learn optimisation basics in Markowitz Portfolio Optimisation: Plain English.
Step 4: Check Equity Exposure Against Goals
Equity overweighting reduces resilience. US endowments and foundations now average 64.8% in public and private equity — likely too high for retirees. Compare your allocation to your timeline:
- Green: Equity % aligns with risk tolerance (e.g., 40% for conservative goals).
- Amber: Equity exceeds 60% for near-term goals, or 70% with low risk capacity.
- Red: Equity exceeds 80% within five years of a drawdown goal.
Use our Compound Interest Calculator to model goal impacts.
Step 5: Review Alternatives (Especially Crypto)
Alternatives like crypto can amplify risk if overused. Stick to sane limits:
- Conservative: 1-3% of portfolio
- Moderate: 3-7% of portfolio
- Aggressive: 5-10% maximum Scoring:
- Green: Within above limits.
- Red: Crypto >10% (extreme volatility risk).
Your Overall Score
- All green: healthy. Schedule checks every 6 months.
- Any amber: Monitor closely. Trim concentrated positions.
- One+ red: Act now. Rebalance or seek advice. Tools like ARIA PM automate dependency analysis, handling survivorship bias, cost modelling, and stress-testing so you focus on decisions. Start your check today: the best time to fix a roof is when the sun’s shining.
Next Step: Run your numbers with the Portfolio Calculator or explore core concepts in Sharpe Ratio Explained.
Real-World Portfolio Health Examples: From Risky to Resilient
Let's examine how hidden dependency risks manifest in three common UK portfolios — and how targeted fixes boost resilience. Remember: your portfolio health score isn't about chasing returns, but exposing vulnerabilities where assets move in lockstep during crises.
1. The Tech-Heavy ISA: Concentration Risk in Disguise Scenario: A Stocks and Shares ISA with 40% in FAANG+ stocks (Meta, Apple, etc.). Though historically high-performing, this creates dangerous concentration. Consider that major tech firms now spend 64% of pre-tax profits on capital expenditure (up from 40% in 2023), squeezing margins. If AI investments underdeliver, a sector-wide slump could devastate the portfolio. Fix: Rebalance tech exposure to ≤25%. Shift freed capital into UK short-dated gilts via platforms like Hargreaves Lansdown. This reduces single-sector dependency while adding low-correlation assets. Use our Portfolio Calculator to simulate rebalancing impacts.
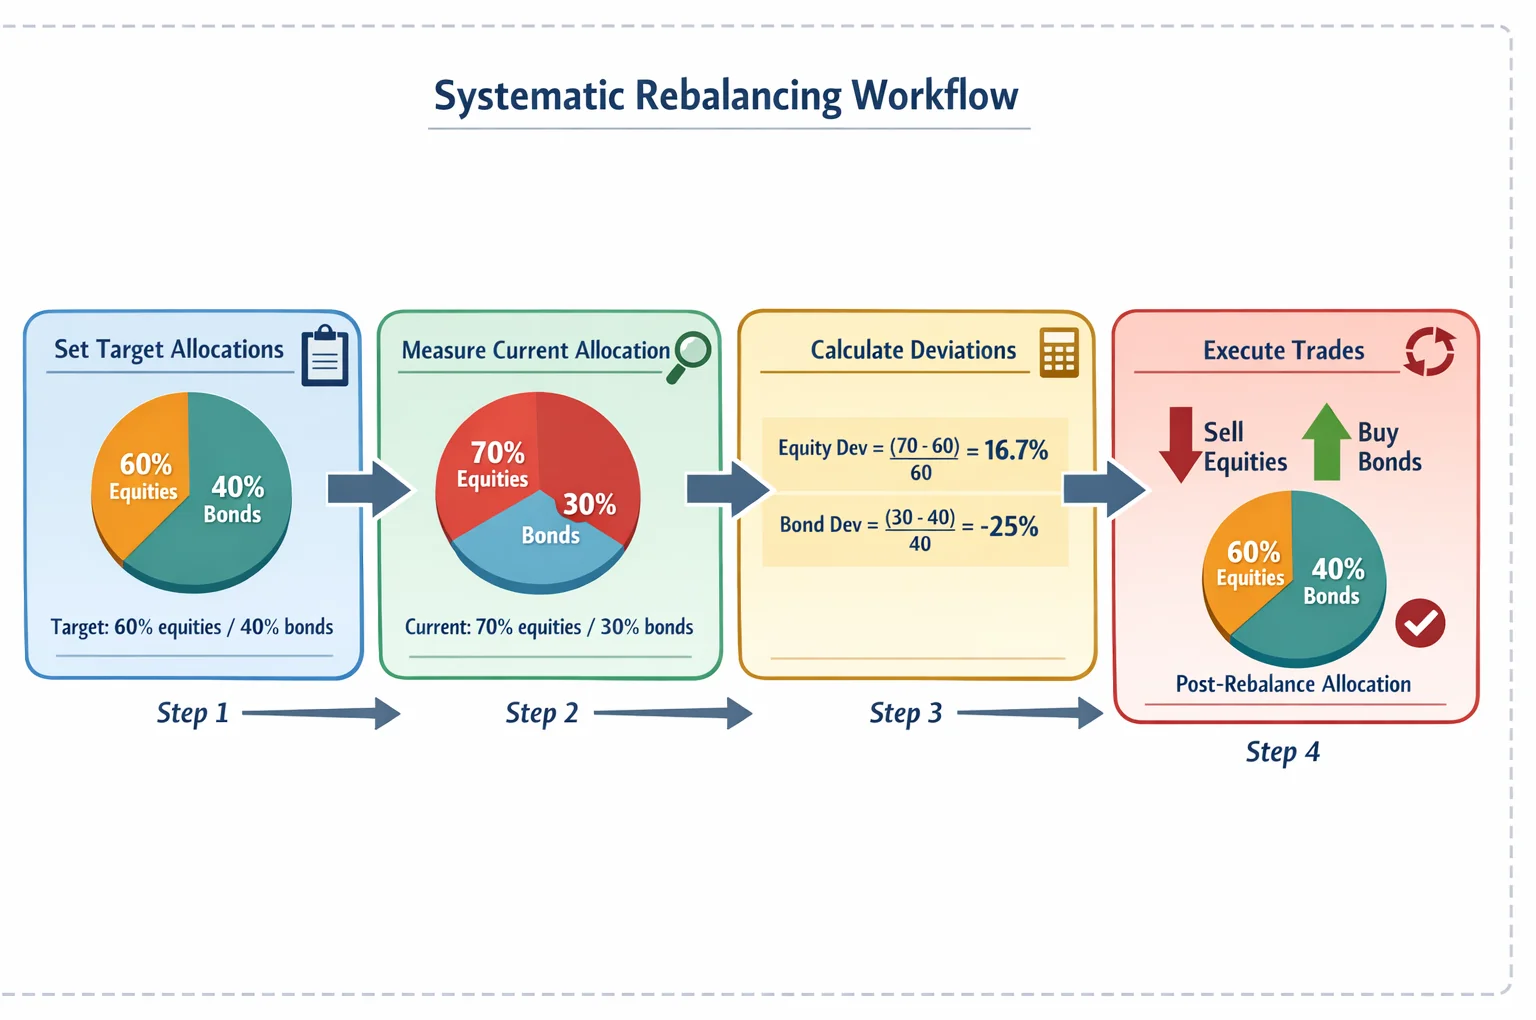
2. The 'Diversified' Pension: Allocation Drift Amplifies Volatility Scenario: A pension plan targeting 60% equities/40% bonds now holds 70% equity funds after years of stock gains. With nine in ten advisors expecting at least a 10% pullback in 2026, this drift magnifies vulnerability. A 20% equity correction would erase 14% of the portfolio’s value versus 12% at the original allocation — a £14,000 loss on a £100,000 pot. Fix: Rebalance to the original 60/40 split. Allocate 10% to short-dated gilts, which historically stabilise portfolios during equity selloffs. The 2025 bond rally underlined the point: the Morningstar Core US Bond Index returned 7.12%, its best year since 2020, as Federal Reserve cuts and corporate performance fed in.
3. The Mixed Portfolio: Strategic Uncorrelation Wins Scenario: A portfolio combining UK gilts, property funds, and equities. The 30% gilt allocation provided critical ballast during 2025’s volatility, demonstrating how non-correlated assets absorb shocks. Property funds add inflation hedging, but require careful monitoring. Fix: Cap alternative investments (crypto, private equity) at ≤5% of total assets. This harnesses diversification without overexposure to illiquid or volatile holdings. Tools like our Correlation Calculator help identify true diversification — not just asset variety, but how they interact under stress.
Why These Fixes Work Systemically Each adjustment targets hidden dependencies: reducing concentration, correcting drift, and capping alternatives. The 2025 bond rally — the best annual return on the Morningstar Core US Bond Index since 2020 — reinforced the role of quality fixed income as a "shock absorber" when equities faltered. Platforms like Interactive Investor simplify rebalancing, but the real work lies in strategic allocation. For deeper analysis, explore Markowitz Portfolio Optimisation — it mathematically proves why uncorrelated assets lower risk without sacrificing returns.
ARIA PM handles survivorship adjustment, cost modelling, and regime stress-testing automatically, so you can focus on interpreting results rather than building the simulation. Start your portfolio health check today: resilience is less about predicting storms than building a boat that won’t sink in them.
The 5 Deadly Portfolio Health Mistakes (and How to Avoid Them)
Your portfolio's true health isn't about headline returns — it's about hidden dependency risks that amplify losses during market stress. Traditional metrics become leading indicators of fragility when analysed systemically. Avoid these critical errors to strengthen your portfolio's resilience:
Infrequent Rebalancing Only a minority of investors rebalance portfolios regularly, letting allocations drift dangerously. This allows high-risk assets to dominate during rallies, exposing you to amplified losses in downturns. Fix: Set semi-annual rebalancing dates (e.g., every January and July). Use our free Portfolio Calculator to identify deviations instantly and realign to target weights.
Ignoring Correlation During Stress In 2022, supposedly "diversified" assets like stocks and bonds fell together as inflation spiked — a pattern many investors didn't anticipate. When markets panic, correlations converge, eroding diversification benefits. Fix: Use free tools like our correlation screener to test how holdings interact during historical crises. Pair this with stress-testing in our Investment Calculator to simulate downturn scenarios.
Overestimating 'Safe' Allocations Many investors hoard excessive cash during uncertainty, believing it's "risk-free." But inflation silently erodes purchasing power, while missing market recoveries compounds opportunity costs. Fix: Limit cash to 3-6 months of living expenses plus near-term goals. Invest the rest using a diversified strategy — even modest returns compound significantly. For example, £10,000 at 7%/yr grows to £19,672 in 10 years; at 0.5% cash rates, it becomes just £10,511.
Chasing AI Trends Without Profit Scrutiny Hyperscalers now reinvest the majority of profits into AI capital expenditure, prioritising growth over shareholder returns. Investors chasing these trends often overlook unsustainable valuations and thin profit margins. Fix: Analyse free cash flow and capex/revenue ratios before investing. Balance AI exposure with profitable value stocks. Remember: capital-intensive growth can delay real returns to investors.
Letting Winners Dominate The "Magnificent 7" tech stocks now make up over 30% of the S&P 500, driving much of recent index performance — but overconcentration in past winners increases vulnerability. Portfolios skewed toward a few names collapse fastest when trends reverse. Fix: Enforce strict position-size limits (e.g., no single stock >5% of portfolio). Rebalance ruthlessly into underperformers. Apply Markowitz diversification principles to prioritise uncorrelated returns over chasing stars.
These mistakes all share a root cause: misjudging how hidden dependencies — between assets, market regimes, and behavioural biases — turn small shocks into systemic failures. ARIA PM handles survivorship adjustment, cost modelling, and regime stress-testing automatically, letting you diagnose these risks in minutes. Start with our free portfolio review checklist to uncover your weak points today.
Your 30-Minute Portfolio Health Action Plan
Stop treating your portfolio like a report card. Remember: portfolio health scores measure hidden dependency risks, not performance — revealing how traditional metrics signal fragility when viewed systemically. Here’s how to act in 30 minutes:
Schedule Rebalancing Now (5 mins) Don’t wait for market chaos. A staggering 40% of investors only rebalance after big swings, locking in losses. Open your calendar and set quarterly reminders. Use our free Portfolio Calculator to model adjustments. If equities surged (the S&P 500 posted roughly a 17.9% total return in 2025), your allocation may be riskier than you think.
Run a Free X-Ray (10 mins) Platforms like AJ Bell offer portfolio “X-ray” tools. These uncover hidden risks — like three funds all banking on AI stocks — that amplify losses during volatility. Integrated analytics (like FactSet’s institutional tools) map cross-asset dependencies, but free versions give instant clarity. Action: Upload holdings and check sector overlaps.
Apply the 5%/25% Rule (5 mins) Slash concentration risk immediately:
- Cap any single stock at 5% of your portfolio.
- Limit sector exposure (e.g., tech) to 25%. Example: If your £50,000 portfolio has £15,000 in energy stocks (30%), sell down to £12,500. This reduces systemic shock vulnerability.
- Set Equity Caps for 2026 Volatility (5 mins) Advisors forecast heightened turbulence by 2026. Match equity exposure to your risk tolerance:
- Conservative: Max 40% equities
- Balanced: 40-70%
- Aggressive: 70%+ Use our Investment Calculator to test scenarios. £10,000 at 7% for 10 years grows to £19,672; at 5%, it’s £16,289 — a £3,383 gap.
- Review Alternatives (5 mins) Assess alternative assets (REITs, commodities) against tiers:
- Core: Low-cost index trackers (e.g., global property funds)
- Satellite: Thematic ETFs (e.g., green energy)
- Niche: Private equity (max 5% allocation) Wealthfront's Classic Automated Investing accounts at risk score 9 reported an average pre-tax return of 9.83% per year since inception — a useful reference point for what disciplined diversification can deliver.
Start Small: Check one fund sector now, like tech or healthcare. Then visit the FCA’s Investor Hub for scam alerts and guidance.
Why This Works: These steps transform hidden risks into visible controls. Tools like ARIA PM handle survivorship adjustment, cost modelling, and regime stress-testing automatically, so you focus on interpreting results — not building simulations. For deeper theory, read our plain-English guide to Markowitz portfolio optimisation.
By acting today, you’re not chasing returns — you’re engineering resilience. When 2026’s swings hit, your portfolio won’t just survive; it’ll adapt.
Explore more tools: Free Tools | Sharpe Ratio Guide | ARIA PM Home
Key Takeaways
- Your portfolio health score primarily measures hidden dependency risks between assets, not investment performance, to gauge vulnerability to systemic shocks.
- Establish a fixed rebalancing schedule (e.g., quarterly or annually) to prevent asset drift, as irregular rebalancing silently concentrates risk.
- Actively check for high correlation between your funds using tools like our Correlation Calculator, as seemingly diversified assets can crash together.
- Analyse traditional metrics like volatility systemically, as they become leading indicators of fragility when revealing underlying dependency risks.
- Identify and reduce exposure to specific sectors (like UK financials) held across multiple funds to mitigate amplified losses during sector-specific crises.
| Aspect | Traditional Approach | Systemic Health Approach | Key Insight |
|---|---|---|---|
| Primary Focus | Performance returns | Hidden dependency risks | Performance metrics become fragility signals when viewed systemically |
| Risk Metric | Volatility (standard deviation) | Correlation under stress events | Low volatility ≠ safety if assets share hidden dependencies |
| Diversification | Number of asset classes | Interconnectedness of holdings | 10 correlated assets offer less protection than 3 uncorrelated ones |
| Time Horizon | Backward-looking (1-5 yrs) | Forward-looking (stress scenarios) | Past calm periods often mask dependency risks that erupt in crises |
| Success Signal | High returns | Resilience to tail-risk events | Surviving 2008/2020 crashes indicates true health more than bull market gains |
Portfolio Health: Risky vs. Resilient Traits
| Characteristic | Risky Portfolio | Resilient Portfolio | Mitigation Strategy |
|---|---|---|---|
| Asset Concentration | >60% in single sector/region | <25% in any one sector | Cap single-name and sector exposure; diversify across uncorrelated sources |
| Cash Buffer | No emergency cash | 3-6 months of expenses in cash/short gilts | Build a cash or short-gilt ladder for crisis flexibility |
| Stress Test Result | >35% drop in 2020-style crash | <20% drop in severe recession | Simulate 2008/2020 scenarios; trim correlated losers |
Sources
- FCA InvestSmart: The golden rules of investing, FCA guidance on evaluating portfolio performance, diversification, and alignment with financial goals.
- FINRA: Evaluating Investment Performance, FINRA's framework for assessing portfolio performance, risk, and benchmark comparisons.
- Vanguard: Tools and Calculators, Vanguard's hub of portfolio analysis tools, including Portfolio Watch, covering diversification and expenses.
- Morningstar: Portfolio Manager, Articles and tools for analysing asset allocation, risk exposure, and performance benchmarking.
- Investopedia: Portfolio Management, Key concepts for measuring diversification, risk-adjusted returns, and concentration risks.
- Bogleheads: Asset Allocation, Community-developed guidance on asset allocation, the foundation of any portfolio checkup.


