

You’ve spent years crunching the numbers into a FIRE Calculator UK, targeting a £750,000 lump sum. That figure feels solid. It isn’t. You are likely aiming a third too high.
The real risk is not a market crash. It is wasting years at a desk you hate, saving money you will never need to spend. Your state pension and ISA allowance will already fund your later life. Pre-funding those years back to age forty inflates your target by a hidden third.
This article answers one question: what is the actual number you must accumulate for the gap between leaving work and drawing those later entitlements? No coding skills required. No financial qualification needed. Just a plain-English walkthrough for self-directed investors ready to stop oversaving. You will learn the three-phase target that finally makes your spreadsheet honest.
What is a FIRE calculator — and why your 'number' is probably wrong
Let’s start with the basics. A FIRE calculator is simply a tool that answers one question: how much money do you need invested before you can stop working? You feed in your annual spending, pick a withdrawal rate, and the calculator spits out a lump sum — your so-called FIRE number. At the traditional 4% withdrawal rate, this equals 25 times annual spending. More conservative assumptions, such as 3.5% and 3%, require approximately 28.6× and 33.3× annual spending, respectively. Many UK investors stop there, thinking they’ve found their target.
Here’s why that single number is probably wrong for you.
The central insight most calculators miss is that your financial independence isn’t a fixed lump sum — it’s a three-phase target. In your early retirement years (say, 40s to late 50s), you need to fund everything yourself. Then the State Pension kicks in, covering a chunk of your baseline spending. Finally, your tax-free ISA drawdown — which you’ve been accruing for decades — becomes accessible without any tax drag, effectively stretching every pound further.
The hidden risk for UK investors isn’t sequence-of-returns risk (the famous danger of a market crash just after retiring). It’s the opposite: over-saving to pre-fund income sources that will already cover your later years. If you calculate a single 25× or 33× number based on your full annual spend, you’re effectively saving to ensure a 50-year-old has the same portfolio firepower as an 80-year-old — even though the 80-year-old has the State Pension and tax-free ISA income flowing in. That can inflate your FI number by a third or more, trapping you in work-years you don’t actually need to work.
The 4%, 3.5% and 3% multipliers are useful starting points, but they assume a flat, level spending path until the end. Real UK retirement is tiered. So the right number is lower — and closer — than you think. The waste isn’t in retiring too early; it’s in saving too much for your 70s while delaying your 40s.
To size this accurately, you need a tool that understands UK tax wrappers (ISA and SIPP), pension access ages, and the State Pension phasing. That’s where a platform like ARIA PM Home becomes relevant — it handles survivorship adjustment, cost modelling, and regime stress-testing automatically, so you can focus on interpreting results rather than building the simulation. For a deeper look at how different calculators stack up for UK investors, read our comparison of the Portfolio Visualizer Alternative for UK Investors. And if you want to see how your portfolio structure affects the three-phase target, the Portfolio Calculator can help you model it plainly.
The number you actually need? It’s the one that gets you out of work in your 40s — not the one that piles cash for a decade you’ll never reach the same way.
How the three-phase target actually works: a step-by-step guide in plain English
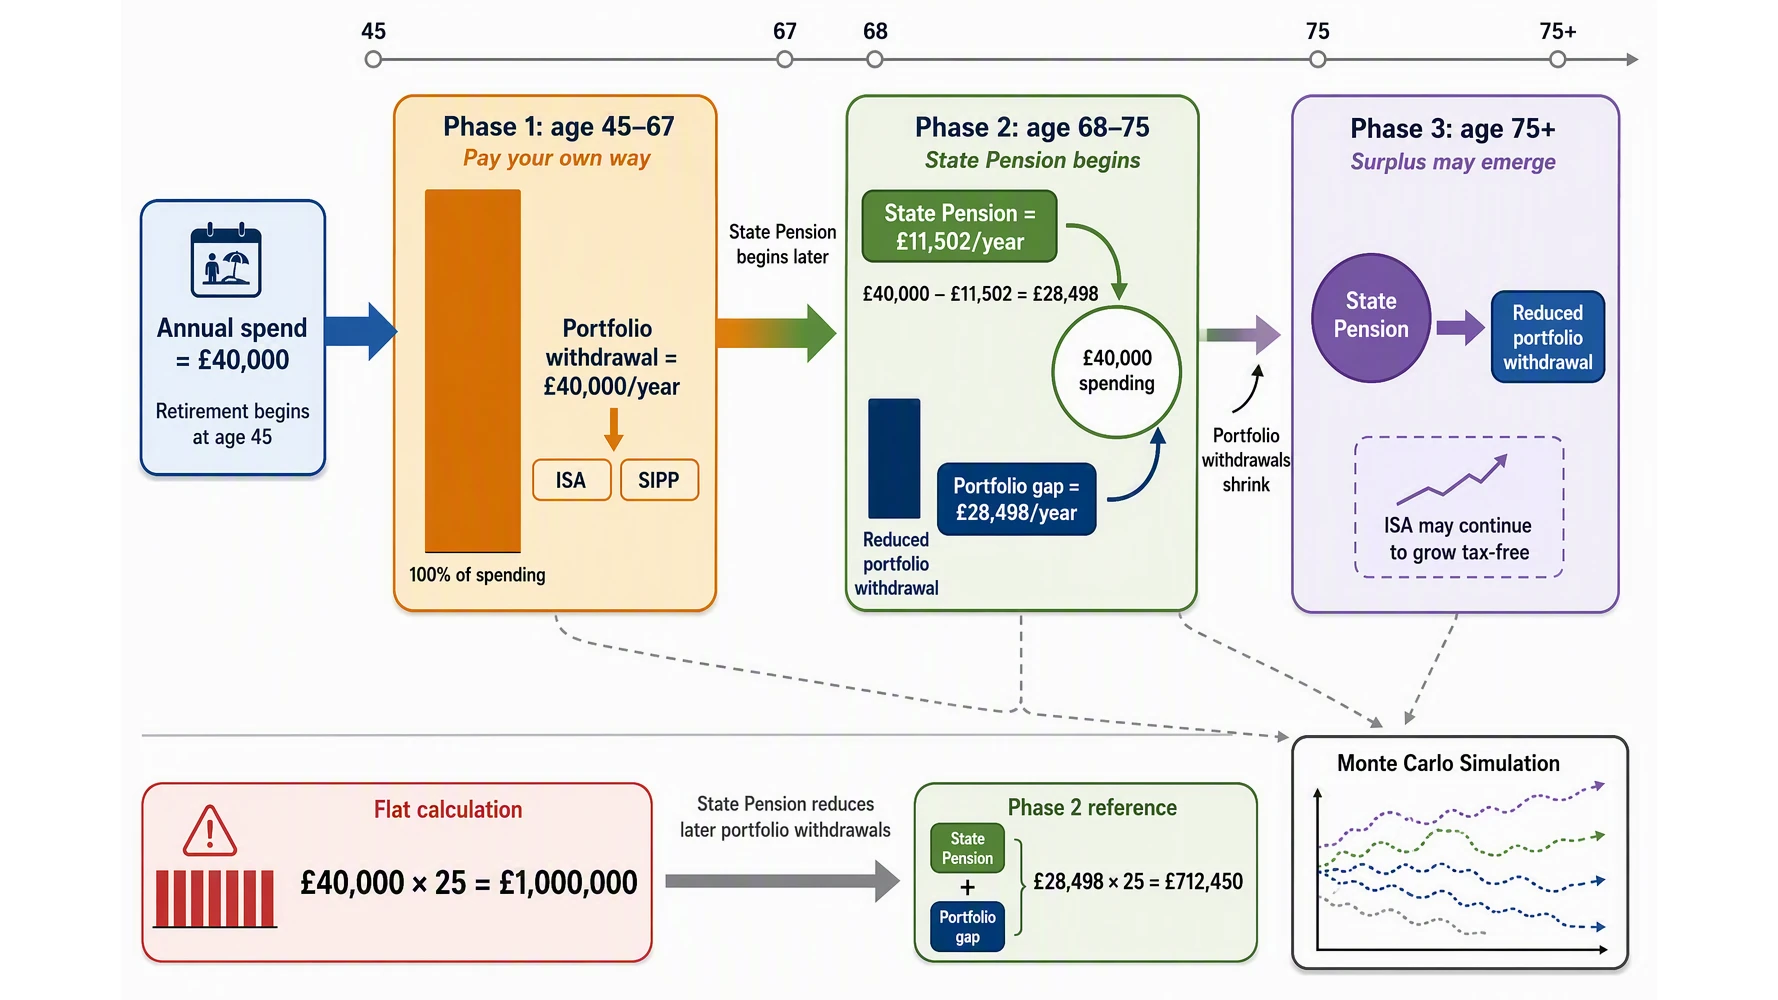
Let's walk through that central insight. The classic US 4% rule says you need 25 times your annual spending. For a £40,000 spend, that is £1,000,000. This is the single figure most FIRE calculators spit out. But if you apply that rule to a UK reality without adjusting for the State Pension, you are targeting roughly £300,000 more than you actually need.
The real target is a dynamic, three-phase number because your required withdrawals change dramatically over time.
Phase 1 (Early Retirement, e.g. age 45-67): The Pay-Your-Own-Way Years Before the State Pension kicks in, you must fund 100% of your spending from your own savings — your SIPP and ISA. This is the most expensive phase. Using our £40,000 spend example, you need a pot large enough to cover that full amount every year, resisting the urge to draw down too fast. This is where Monte Carlo Simulation becomes essential — it tests your portfolio's survival probability across thousands of random market scenarios, showing you whether your drawdown strategy holds up through a 2008-style crash or a lost decade.
Phase 2 (Mid Retirement, e.g. 68-75): The State Pension Kicks In Once the State Pension arrives — £11,502 per year in 2025-26 — your required withdrawal from your own pot drops. Your £40,000 spend now only needs roughly £28,500 from savings. Your tax-free ISA income and the State Pension cover the rest. This phase demands a smaller pot, so your original target of £1,000,000 is already too high. If you recalibrate: £28,500 x 25 = £712,500. That is your true Phase 2 target.
Phase 3 (Late Retirement, 75+): Surplus May Emerge By this stage, the State Pension may cover your core costs entirely. If your ISA has continued to grow tax-free, you might have surplus — not a shortfall. The risk of over-saving becomes real. You have pre-funded a later life that your State Pension and ISA will already handle.
This is why Withdrawal Rate Scaling matters. A more conservative 3.5% withdrawal rate — requiring 28.6x spending — would push the plain £40,000 target to £1,142,857. But after subtracting the State Pension, that same approach requires only £815,100 — still far below £1,000,000. The hidden third you are over-saving is roughly £287,500.
The UK's different tax wrappers — the ISA and SIPP — alongside the State Pension access age, fundamentally change the maths. A US 4% rule transplanted here inflates your target. For a detailed comparison of how UK platforms handle this, see our Portfolio Visualiser Alternative for UK Investors. To run the numbers on your own portfolio using proper UK assumptions, ARIA PM Home offers a free Monte Carlo simulation that accounts for these three phases automatically — your only job is to interpret the results. For tracking actual progress across your ISA and SIPP, our Best Portfolio Tracker for ISA and SIPP: UK Options Compared covers the practical tools.
The 'hidden third' that inflates your FI number — and how to recover it
The core mistake in most UK FIRE calculations is simple: you treat the State Pension as a bonus rather than the bridge it actually is.
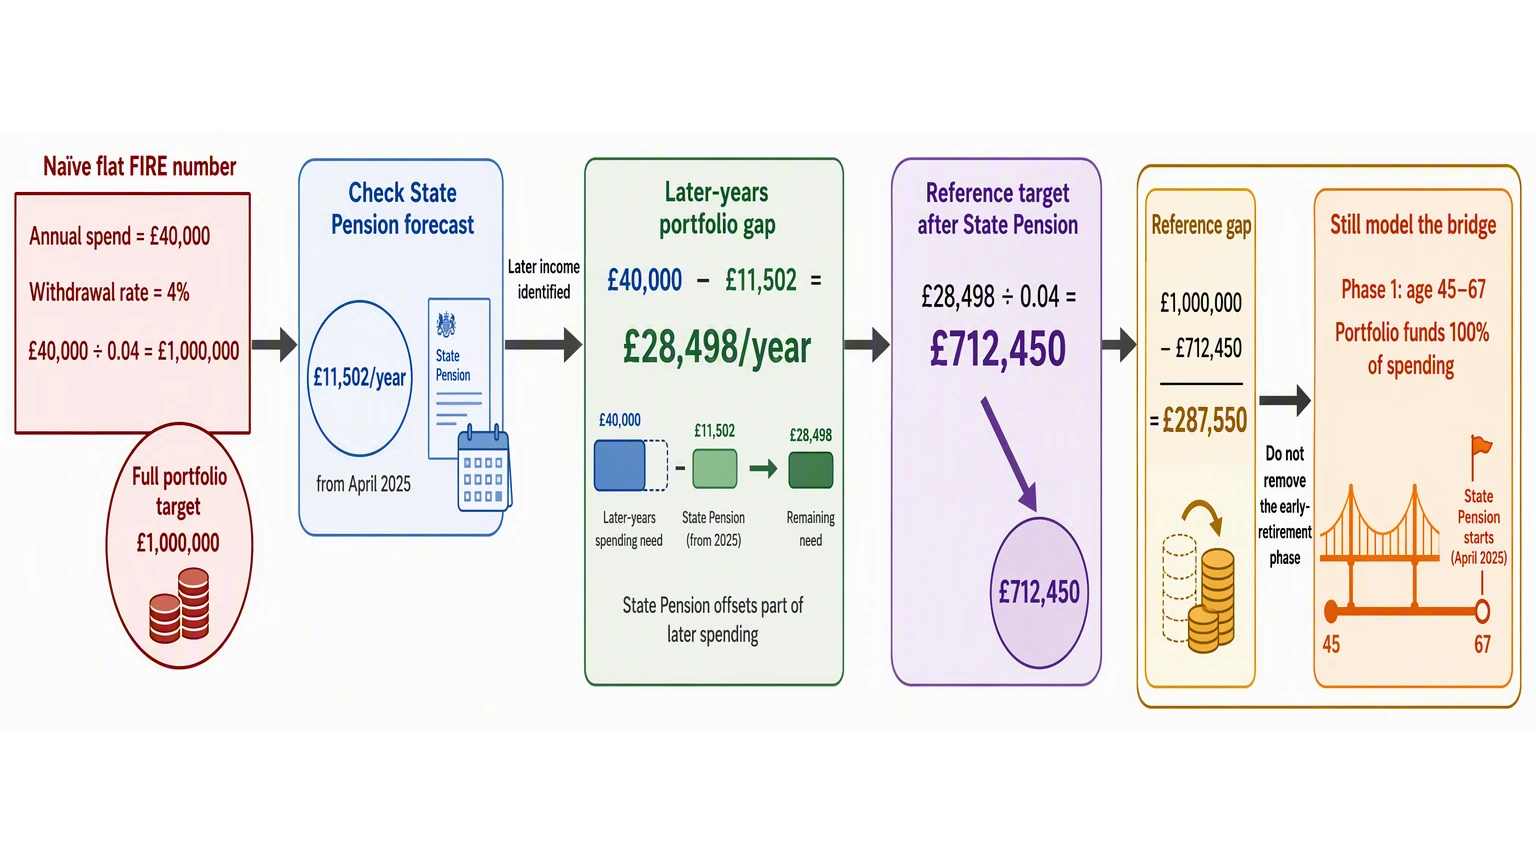
Here’s the maths that matters. Imagine your annual retirement spend is £40,000. The full new State Pension from April 2025 will pay £11,502 per year, indexed to inflation. That means in your later years — once you draw it — your own portfolio only needs to supply £28,498 annually. At a 4% withdrawal rate, that’s a portfolio of £712,450. Not £1,000,000. That gap of £287,550 is the hidden third you don’t need.
Now run the same logic at higher spending levels. For a £50,000 spend, the State Pension drops your required pot from £1,250,000 to roughly £962,500 — a difference of nearly £288,000. For £60,000, you go from £1,500,000 down to around £1,212,500. At £80,000, the target falls from £2,000,000 to £1,712,500. And at £100,000 spend, it drops from £2,500,000 to £2,212,500.
The danger isn't being too conservative — it's over-saving to pre-fund an income stream that already exists. Because the State Pension is inflation-linked and tax-free up to your personal allowance, it’s one of the most reliable cash flows a UK retiree has. Ignoring it means you risk working an extra 5 to 7 years needlessly.
This is where historical backtesting becomes essential. A proper FIRE calculator doesn’t just check your number against a single 30-year period; it tests your plan across a retirement horizon of 40 to 50 years, covering the full span from early retirement through State Pension age. Many free UK tools, like ARIA PM Home, handle this automatically — simulating your drawdown through the Great Depression, the 1970s stagflation, and the dot-com crash to see if your plan survives both the early years (when you’re drawing down your own pot) and the later phase (when the State Pension kicks in).
The shift is subtle but profound. Instead of targeting one lump sum, you’re aiming for a three-phase target: a bridging phase before State Pension age, a mid-phase where it partially covers you, and a late phase where your own withdrawals shrink further. Your Portfolio Calculator should reflect that dynamic, not a single flat number.
The real question isn’t “How much do I need?” — it’s “How much do I need, and when?” The hidden third is recoverable, but only if you stop treating the State Pension as an afterthought and start building it into your FIRE number UK from day one.
Real-world tools and platforms: how to run the numbers yourself
Now for the practical part. The core adjustment is simple: subtract your State Pension from your target annual spend, then model only the remainder. But to do that properly, you need the right tools.
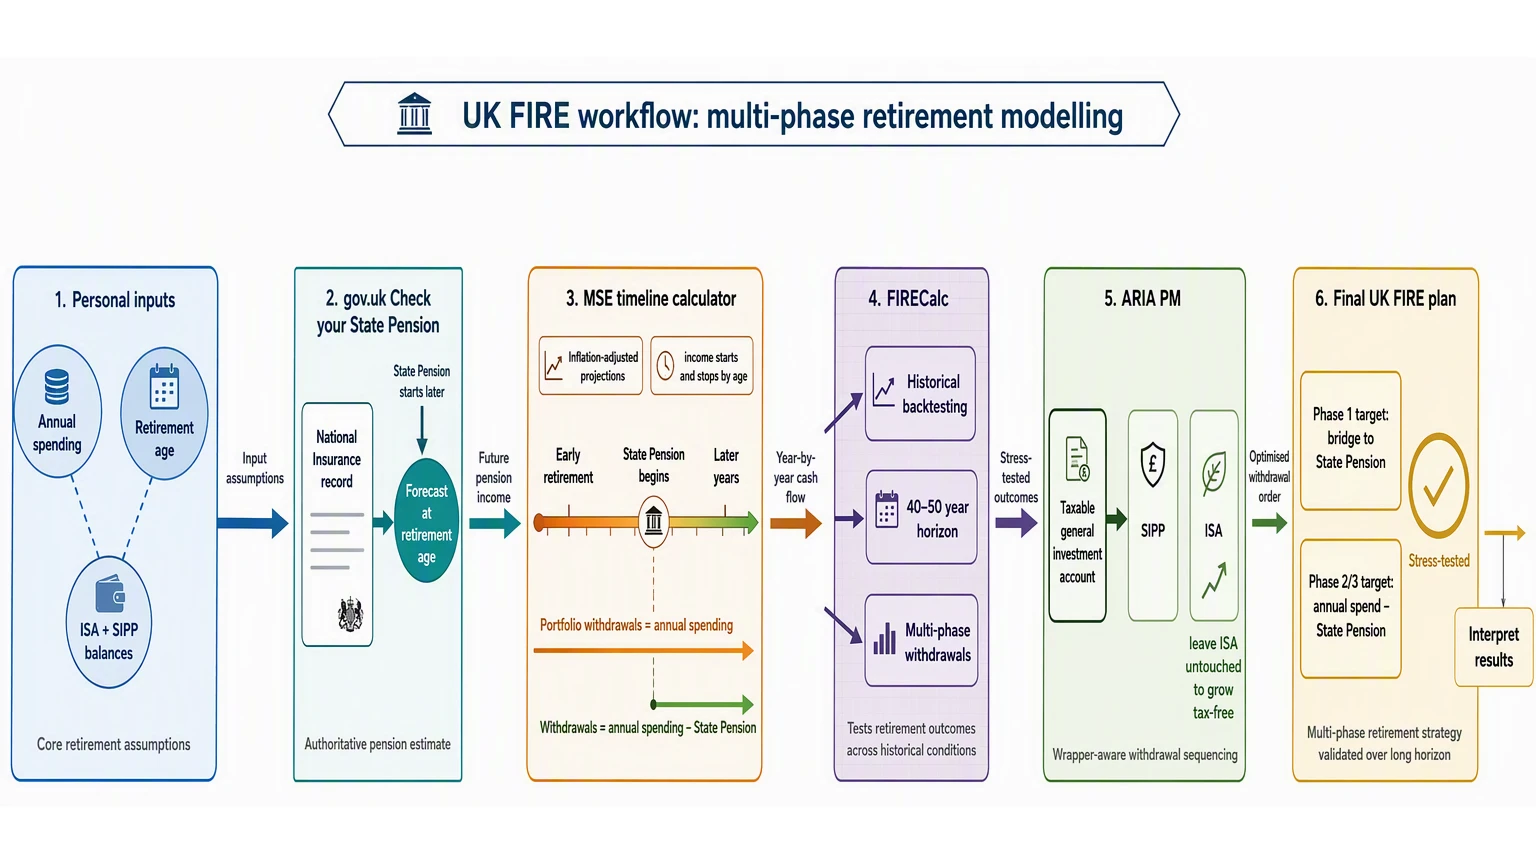
Start with the Money Saving Expert (MSE) timeline calculator. It is a clean, free spreadsheet that lets you project cash flows year-by-year. You can set different income sources to start and stop at different ages — ideal for modelling the gap between early retirement at, say, 50 and State Pension age. The MSE tool handles inflation-adjusted projections (''), so your spending and portfolio values appear in today's pounds, preventing you from overestimating how much you actually need. Many investors find this alone slashes their target by imagining their £35k spend as £50k in 20 years, when the calculator reveals the real figure is lower in real terms.
Next, use FIRECalc with its updated April 2026 dataset. This US-origin tool is clunky but invaluable because it supports multi-phase withdrawals. You can input two distinct periods: one withdrawal rate from age 50 to 67, then a lower rate after State Pension kicks in. The updated dataset includes more recent market history, making the historical backtest more representative. Combined, these two tools let you run your real numbers — not a generic '4% rule' that fails for the UK's split-phase reality.
For the State Pension figure itself, use the Guiide lifetime annuity tool as a forecasting aid. More importantly, download your official forecast from the gov.uk 'Check your State Pension' service. This is authoritative, not guessed. For account sequencing (''), a Portfolio Visualizer Alternative for UK Investors like ARIA PM helps model the optimal drawdown order: taxable general investment account first, then your SIPP, leaving your ISA untouched to grow tax-free until later. ARIA PM handles survivorship adjustment, cost modelling, and regime stress-testing automatically — so you can focus on interpreting results rather than building the simulation.
Finally, the Royal London 'How much do I need' tool gives a quick sanity check. It assumes a single lifelong withdrawal, so it will inflate your number — exactly the trap we are avoiding. Use it only as a baseline before applying the State Pension subtraction.
Concrete example: A 35-year-old spending £35k/year wants to retire at 50. Their State Pension forecast at 67 is £11,500/year. So from age 67, they only need £23,500 from savings. Modelling a 4% withdrawal on that net amount for the later phase, and a higher withdrawal for the 'gap' phase, their target drops from roughly £875k (the naïve number) to around £595k — a 32% reduction. That is the hidden third: the money you would have over-saved to pre-fund what the State and your ISA already cover.
None of these calculators is perfect — they all default to a single lifelong withdrawal. The fix is manual, but simple: subtract your State Pension before you type anything in. That one adjustment transforms your number.
For a full breakdown of which UK tools actually handle multi-phase modelling and which (like Trading 212's tracker) miss it, see our Best Portfolio Tracker for ISA and SIPP: UK Options Compared. And if you want to stress-test your own three-phase plan, the ROI Calculator and Portfolio Calculator are good places to start.
Common mistakes that make UK retail investors over-save by decades
Let’s look at the specific mistakes that inflate your target by decades — errors so common that industry research shows most workers are confidently wrong.
Mistake 1: Treating the State Pension as an afterthought. Roughly half of workers can’t guess their entitlement to the full new State Pension (£221.20/week in 2025/26). If you ignore it entirely, you effectively pre-fund an income stream that already exists, inflating your target by £100,000+. The fix: check your National Insurance record and include the State Pension as a phased income source in your later years — not as a bonus, but as a core pillar.
Mistake 2: Using a single withdrawal rate across 50 years. The famous 4% rule assumes constant real income forever. But your actual retirement splits into three phases: early years (drawing from ISAs tax-free), middle years (bridging to pension access), and later years (State Pension kicks in plus SIPP drawdown). A flat 3% withdrawal applied to all phases forces you to save as if you’ll have zero income at age 68 — adding roughly a decade of extra saving. The fix: phase-shift your withdrawal rates downward in early retirement and upward later, reflecting when the State Pension arrives.
Mistake 3: Overlooking the ISA tax wrapper’s effect on your gross pot. Money withdrawn from an ISA is tax-free. Yet many calculators assume a blended tax rate on all withdrawals, which inflates the required lump sum. If you plan to draw £30,000/year entirely from ISAs during early retirement, your effective tax rate is zero — meaning your gross pot needs to be smaller than a US-style calculator suggests. The fix: run all projections in after-tax pounds, and use a tool like ARIA PM that models ISA and SIPP wrappers separately, so you aren’t over-saving for a tax bill that never materialises.
Mistake 4: ‘One-number thinking’ — aiming for a fixed lump sum and stopping. The idea that you need £800,000, full stop, ignores that your spending and income sources change. That single number might represent Coast FIRE for one investor (no further contributions needed) yet be dangerously low for another facing a 50-year horizon. You don’t need a pile of cash — you need a dynamic plan that adjusts as the State Pension vests and your ISA compound interest continues. The fix: define your target as a sequence of annual income targets, not a static total.
The 2025 EBRI confidence data shows 67% of workers feel confident about retirement — but only 24% are very confident. That gap reveals high confidence paired with low precision. If you work from a single pot number, you’re likely over-saving by decades, because you’re pre-funding a State Pension that will pay itself. Use a calculator that phase-shifts, applies the correct tax wrappers, and includes the State Pension — then let the tool show you the number you actually need, not the one that feels safe.
Your action plan: what to do this week to find your real FIRE number
Let’s turn that thesis into action.
Step 1: Get your State Pension forecast (it takes five minutes). Go to gov.uk/check-state-pension. That page will show you your current entitlement and your forecast at retirement age. Write down the weekly amount, multiply by 52, then multiply by roughly 0.80 to be conservative (the “triple lock” isn’t a guarantee). This single number — likely between £9,000 and £11,000 a year — is the foundation of your later-phase income.
Step 2: List your current annual spending. Open your banking app — Monzo, Starling, or your bank’s spending tracker will already categorise most of your outgoings. Add up everything for the last full year, including predictable annual bills, holidays, and one-off home repairs. If you’re using a budgeting tool that shows a 12-month total, that’s perfect. If not, export the last three months and multiply by four — then check for annual expenses like insurance or a car service.
Step 3: Subtract the State Pension from that spend. This is the critical calculation most UK FIRE calculators miss. For the phase from age 67 onwards, your portfolio only needs to cover the gap between your State Pension and your actual spending. If you spend £35,000 a year and your forecast State Pension is £10,500, then your Phase 2/3 pot only needs to fund £24,500 a year — not £35,000. That’s a third less income requirement, which shrinks the target pot by roughly the same proportion.
Step 4: Use that smaller number in a FIRE calculator. Set a 4% withdrawal rate for Phase 1 (early retirement before the State Pension and SIPP access kick in). For Phase 2 and Phase 3 (once you’re drawing the State Pension and potentially a tax-free ISA income), you can use a 5-6% ‘natural floor’ rate — those income sources are far more secure than a volatile portfolio, so the withdrawal rate can be higher without meaningful risk. Build both phases into one projection. A tool like ARIA PM handles this split automatically — it applies survivorship adjustments and regime stress-testing so you can see whether a 5% withdrawal for later years actually holds up, rather than building your own simulation.
Step 5: Check if you’re already within 5-10 years of that target. Industry research from Fidelity suggests that, among its 401k plan participants, the average balance reached $304,200 for those continuously using the same plan for five years. For a UK context, if your SIPP and ISA combined are around £150,000 at age 40 — and you have a good State Pension forecast — you may be closer than you think. Run your numbers through a Compound Interest Calculator to see what your current savings trajectory delivers. If you’re within a decade, coast-FIRE (reducing your savings rate while letting the existing pot grow) becomes a sensible option. You can also check your portfolio’s balance against a Portfolio Health Check to identify any concentration risk or fees dragging you down.
The two-number test: Write down your Phase 1 pot target and your Phase 2/3 pot target on a piece of paper. If they differ by more than 30%, you have found the hidden third — and can stop over-saving today. That difference is the cushion you were unknowingly building to prefund a State Pension you already paid for.
Key Takeaways
- Your true FIRE number is not a fixed lump sum but a three-phase target that shrinks as the State Pension and tax-free ISA income cover your later years, meaning the static 25× multiplier inflates your goal by a hidden third.
- Sequence-of-returns risk is not your primary threat — over-saving to pre-fund income sources that already exist later in retirement is what traps you in unnecessary work years.
- Calculate separate portfolio needs for your early self-funded years (40s-50s), then for the period after the State Pension starts, and finally for the tax-free ISA drawdown phase, rather than applying a single flat spending assumption.
- You can reduce your required savings by roughly one-third because the 80-year-old version of you has the State Pension and tax-free ISA income flowing in, while the 50-year-old version must fund everything alone.
- Use a tiered withdrawal strategy instead of a flat 4% rule: draw more aggressively from taxable accounts in early retirement, then slow down once the State Pension and ISA income activate to avoid hoarding capital you will never need.
| Factor | Standard 4% Rule Approach | Three-Phase Target Approach |
|---|---|---|
| Target calculation | 25 x annual spending (e.g. £1,000,000 for £40,000 spend) | Only fund the gap after subtracting State Pension from spending |
| Treatment of State Pension | Treated as an afterthought or bonus | Built in as the final phase bridge |
| Risk focus | Sequence-of-returns risk on the full pot | Over-saving by pre-funding costs already covered later in life |
| Hidden cost in target | None identified | Inflates FI number by roughly one third |
| Best for | US investors with no state pension bridge | UK investors with full State Pension entitlement |
Tools and platforms for running your own UK FIRE numbers
| Tool | What it does best | Key limitation | Best used for |
|---|---|---|---|
| Money Saving Expert pension calculator | Models State Pension and personal pension together | Basic, no detailed withdrawal modelling | Quick sanity check on your target |
| Gov.uk State Pension forecast | Shows your current entitlement and gaps | One-off snapshot, not a modelling tool | Checking your exact State Pension amount |
| Standard FIRE calculator with 4% rule | Quick lump sum calculation | Ignores UK State Pension and tax-free ISAs | Only as a starting point, then adjust |
| Spreadsheet with phased withdrawal | Custom three-phase modelling (early, bridging, full pension) | Requires time to build and maintain | The most accurate UK FIRE number |
Sources
- Planning as you approach retirement - Tax Confident — Guidance on tax considerations and planning steps as you approach retirement in the UK.
- Individual Savings Account (Amendment) Regulation 2026 - GOV.UK — Details on new ISA contribution limits and rule changes effective from 2026.
- ISA reform 2027: anti-circumvention rules factsheet - GOV.UK — Facts about anti-circumvention rules for ISAs introduced in the 2027 reforms.
- Inheritance Tax: unused pension funds and death benefits - GOV.UK — Explanation of how unused pension funds are treated for Inheritance Tax purposes.
- Pension Schemes Act 2026 — Overview of key changes under the Pension Schemes Act 2026 affecting retirement planning.
- FIRE Calculator - Financial Independence and Retire Early - Calculator Academy — A basic FIRE calculator tool for estimating the savings needed for early retirement.