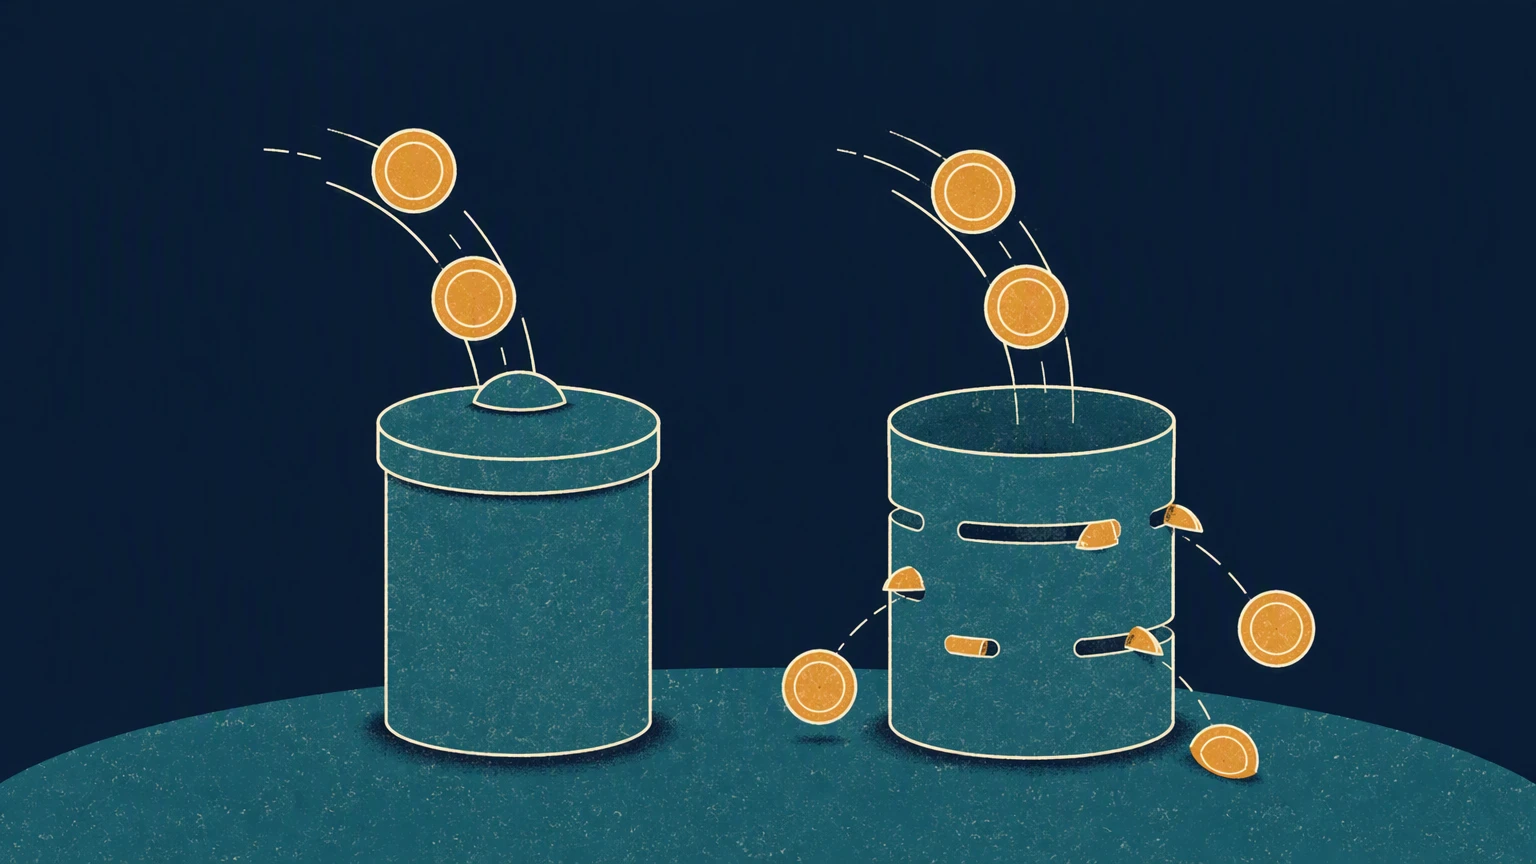

Picture this: you are 58, with £180,000 spread across your SIPP and ISA, and every online calculator tells you that is not enough to retire in five years. The risk is that you keep saving past the point where you already have enough, or — worse — you retire too early and run out. This article answers one question: how do you know the exact size your pot actually needs to be, not for an average person, but for you? A Retirement Nest Egg Calculator can help, but only if you stop treating your pot like a fixed pile of cash. Your pot is a liability-matching engine. The state pension already covers a chunk of your spending. When you draw from ISAs first and your SIPP later, the tax you save shrinks the pot you truly need. No maths degree required. This is for self-directed investors, not developers.
What is a Retirement Nest Egg Calculator — and why your pot size isn't a fixed number
You’ve probably heard the rule of thumb: “You need £500k to retire.” Or maybe £1 million. These round numbers feel reassuringly solid. But they’re also a trap. The biggest mistake UK investors make is treating their retirement nest egg calculator as a fixed target — as if your pot is a pile of cash you must stack to a certain height before you’re allowed to stop working. That’s not how retirement finance actually works.
In reality, your pot is a dynamic liability-matching engine. The question isn’t “How much do I want to spend?” It’s “How much of that spending does the state already cover — and how do I sequence the rest?” Once you answer those two things, the optimal pot size often shrinks dramatically.
Start with the floor. The full new State Pension for 2026-27 is £241.30 a week — that’s £12,547.60 a year. Before you calculate anything else, that income is already guaranteed (assuming you qualify for the full amount). If you want to spend £30,000 a year, you’re not funding £30,000 from your pot. You’re funding the gap: roughly £17,450. The state pension is not a bonus on top of your savings — it’s the foundation that reduces the size of the pot you actually need.
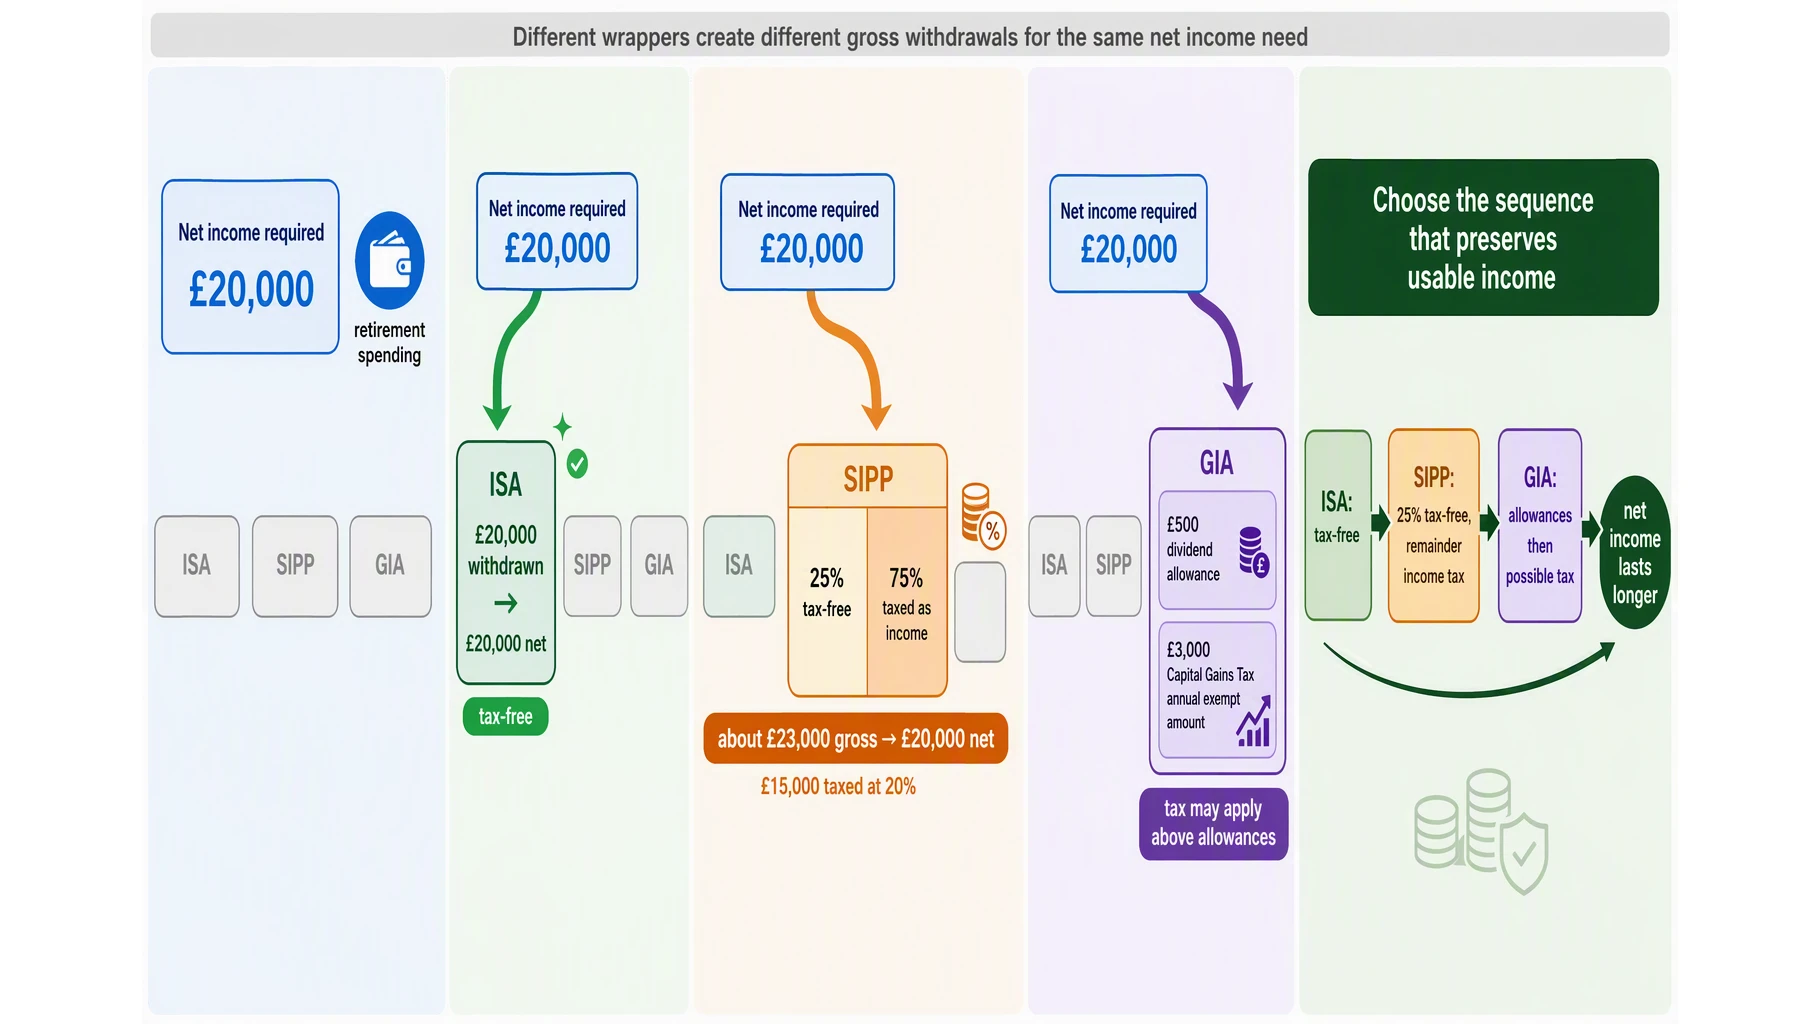
Now layer in tax-efficient drawdown sequencing. The order in which you withdraw from your ISA, SIPP and GIA changes how much of your pot you keep. The standard playbook: draw your ISA first (gains and dividends inside an ISA are tax-free), then your SIPP (where 25% is tax-free and the rest is taxed as income), and finally your General Investment Account, where your personal £500 dividend allowance and £3,000 Capital Gains Tax annual exempt amount for 2026-27 are the only shelter left. By sequencing withdrawals this way, you can cut the taxable income you extract each year — meaning a smaller pot stretches further.
Industry research from the DWP shows why this matters. Using target replacement rates — the percentage of pre-retirement earnings needed to maintain living standards — an estimated 43% of working-age people (14.6 million) are undersaving. They’re aiming for a pot size based on gross spending, not the net gap after the state pension floor and tax-efficient sequencing are applied. That mismatch is why 82% of UK workers are now enrolled in a workplace pension (2024 data), yet undersaving persists: the target people chase is inflated.
A retirement nest egg calculator is not a one-size-fits-all number generator. It models the gap between what you want and what the state guarantees, then stress-tests how your chosen drawdown order — ISA first, then SIPP, then GIA — performs against sequence-of-return risk, inflation and longevity. The answer isn’t “£X is enough.” It’s “this drawdown plan, from these wrappers, plugged into this spending gap, survives 95% of market scenarios.” That’s a very different — and far more useful — definition of enough.
If you’re used to thinking in fixed pot sizes, the Best Free Portfolio Tracker UK: What You Actually Get Without Paying can help you see where your current mix actually lives across tax wrappers. That awareness is the first step toward shrinking the number you think you need — and realising you might already be closer than you thought. For a deeper look at how portfolio construction affects your withdrawal longevity, the Minimum Variance Portfolio Calculator: Lowest-Risk Allocation shows why volatility matters more than raw returns when you’re drawing down. And if you ever wonder whether a fixed-sum target like a Perpetuity Calculator (which assumes your pot never depletes) is realistic for UK retirees — the answer is almost never yes, given inflation and tax drag.
Why sizing your pot matters: the hidden value of the state pension floor and tax wrapper sequencing
Why sizing your pot matters: the hidden value of the state pension floor and tax wrapper sequencing
The single most important insight is that your retirement 'pot' is not a stack of cash but a dynamic liability-matching engine: the correct size is determined not by what you want to spend, but by the gap between that spending and the state pension floor, governed by the tax-efficient sequencing of drawdown from different wrappers — meaning the optimal pot size shrinks dramatically once you account for how much of your income the state already guarantees and the order in which you tap ISA, SIPP and GIA accounts.
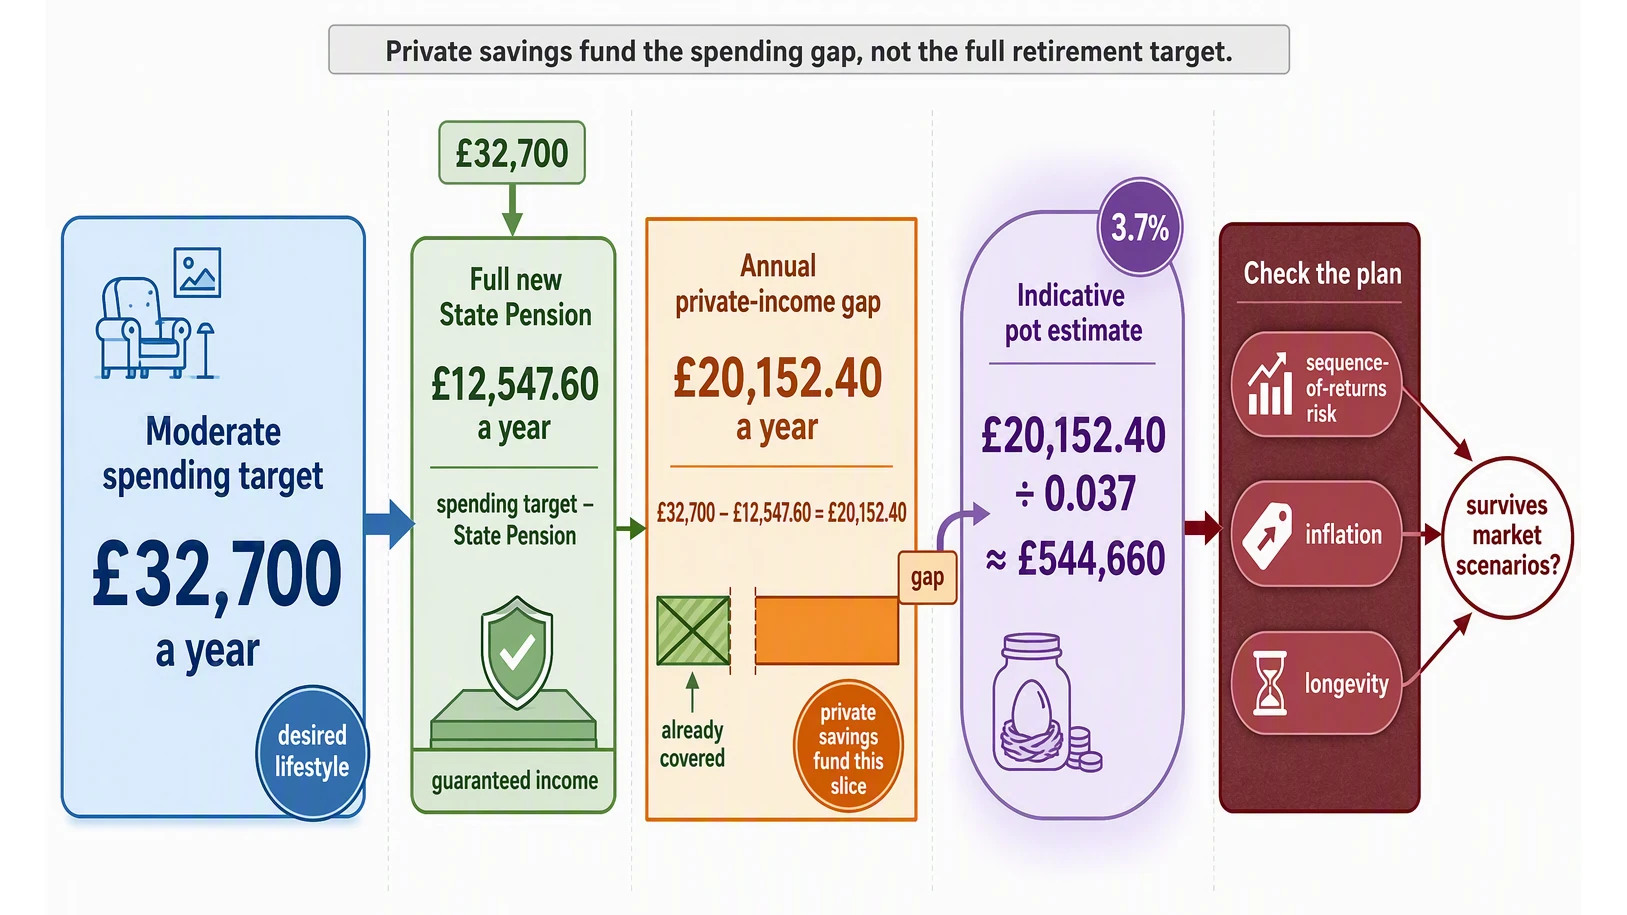
For a single person on the full new State Pension, that’s already £12,547.60 a year in 2026-27. Compare that to the 2026 Retirement Living Standards, which are stated in 2025 prices: the Minimum lifestyle requires £13,900 annually, meaning the state covers over 90% of that floor. The Moderate standard of £32,700 leaves a gap of roughly £20,150. Even the Comfortable level of £45,400 leaves a shortfall of about £32,850 — not the full £45,400 many assume they must fund themselves. This floor changes everything: you are not saving for the whole amount, only the slice above what the state already provides. A retirement nest egg calculator that ignores this floor will overstate your target by decades’ worth of contributions, potentially tempting you to over-save at the expense of living well today.
The second hidden lever is tax wrapper sequencing. Drawing from an ISA first (tax-free at all times) lets your taxable SIPP and GIA continue compounding untouched. When you later tap the SIPP, you can take 25% tax-free, then pay income tax on the remainder — but if you defer it, the pot keeps growing. Finally, a GIA incurs dividend tax (currently 10.75% at the basic rate above the £500 allowance) and capital gains tax on gains above the £3,000 annual exempt amount. Draw in the wrong order — say, emptying your SIPP first — and you permanently lose the tax-free ISA compounding that could have stretched your retirement income by years. ARIA PM handles survivorship adjustment, cost modelling, and regime stress-testing automatically — so you can focus on interpreting results rather than building the simulation.
More than 22 million people were saving into a workplace pension in 2023 — over 10 million more than in 2012, on an auto-enrolment minimum of 8% of qualifying earnings (between £6,240 and £50,270, split 3% employer and 5% employee). But that minimum alone may overfill the gap for some and underfill it for others. Understanding the precise gap, then sequencing drawdowns to minimise tax, is what a proper calculator does: it doesn’t scare you with a round number, it sizes the pot to match your actual spending net of the state guarantee, applied in the right wrapper order.
How the calculator actually works: a plain-English step-by-step guide
Let’s walk through the logic of how this calculator actually sizes your pot. Forget the headline numbers you see on forums — the real maths is both simpler and more revealing.
Step 1: Define your spending target. The Pensions and Lifetime Savings Association offers three UK benchmarks for a single person, stated in 2025 prices. Minimum is £13,900 a year (covers basics with a little left over). Moderate is £32,700 (adds a holiday, eating out, a car). Comfortable is £45,400 (significant travel, hobbies, flexibility). Pick your version of a good retirement — not what you think you should say.
Step 2: Subtract the state pension floor. The full new state pension is roughly £12,548 for 2026-27. If you have a guaranteed defined benefit pension from an old employer, subtract that too. What remains is the annual gap — the amount your private savings must deliver each year. This is the single biggest lever on your pot size. Many people discover their gap is half what they feared.
Step 3: Apply a sustainable withdrawal rate. The famous 25× rule is simply the inverse of a 4% initial withdrawal rate. But industry research by Morningstar in 2025 suggested a more cautious 3.7% for a 30-year retirement with a 90% success rate, given today’s lower bond yields and higher valuations. So the formula is:
Pot needed = annual gap ÷ withdrawal rate
If your gap is £15,000 a year, at 4% that’s £375,000 (£15,000 ÷ 0.04). At 3.7%, it’s £405,405 (£15,000 ÷ 0.037). Small rate changes move the number significantly.
Step 4: Account for tax wrapper sequencing — where the real optimisation lives. The order in which you withdraw from ISAs, SIPPs, and General Investment Accounts changes how much tax you pay, and therefore how large your pot truly needs to be. Example: you need £20,000 net in 2026-27. If you take it all from an ISA — zero tax. If you take it from a SIPP, you get 25% tax-free cash (£5,000), but the remaining £15,000 is taxed at your marginal rate. With that £15,000 falling in the 20% basic-rate band, you’d pay £3,000 tax, so you’d need to withdraw about £23,000 to clear £20,000. That means a bigger pot to start with — or better sequencing.
The correct calculator models this. ARIA PM handles survivorship adjustment, cost modelling, and regime stress-testing automatically — so you can focus on interpreting results rather than building the simulation. Tools like the Best Free Portfolio Tracker UK help you monitor progress, but the core insight remains: your pot size shrinks dramatically once you subtract the state floor and tax-optimise your withdrawal order. You aren’t stacking cash; you’re sizing a liability-matching engine.
Real-world examples: how UK investors are using this approach today
Theory is all very well, but how does this play out for real people? Consider the Interactive Investor case who reached a seven-figure SIPP by their early 60s. It would be easy to assume this was down to stock-picking heroics. In reality, the key was a generous workplace pension — with significant employer contributions and years of salary sacrifice — combined with disciplined tax planning. They used that employer match as the engine, then topped up the SIPP with personal contributions to reclaim higher-rate tax relief. The investment returns mattered, but the structural advantages of their pension wrapper did the heavy lifting. Without that employer foundation, the pot would have been hundreds of thousands smaller.
Then there’s the First Wealth couple, Susan and Chris. They wanted £60,000 annual spending in retirement but had a personal pension of just £120,000, an ISA of £90,000 and some rental income. A traditional "pot size calculator" would have flagged a shortfall. But a retirement nest egg calculator that models the gap — subtracting the state pension floor (roughly £25,100 for a couple on two full new state pensions) and mapping tax-efficient drawdown sequencing — tells a different story. By drawing the rental income first, then the ISA (tax-free), then the personal pension later (using the 25% tax-free lump sum to cover a lumpy expense), the income gap shrinks to something manageable. The calculator shows they aren't short of cash; they're short of the right order.
Neligan Financial provide another useful example. A client near retirement wanted to gift a significant sum to their children. Cash-flow modelling using this exact principle — treating the pot as a dynamic liability-matching engine — confirmed the gift was affordable without jeopardising income. Because the state pension floor was secure, and the remaining drawdown could be sequenced from the ISA (avoiding tax) before touching the pension, the lump sum didn't create the cliff-edge the client feared.
The tools available are finally catching up with this logic. Vanguard UK's pension calculator, NEST's Retirement Date Fund tool, and the People's Pension's new regular-income planning tool (launched December 2025) have all moved away from simple "pot size forecasting" toward income sustainability modelling. This shift aligns with the FCA's new targeted support framework from April 2026, which expects providers to help investors understand income sustainability, not just accumulation totals. For serious UK investors, a dedicated platform like ARIA PM handles survivorship adjustment, cost modelling, and regime stress-testing automatically — so you can focus on interpreting results rather than building the simulation. The result? A retirement plan that reflects your actual liabilities, not a round-number guess.
The key metrics that drive your nest egg calculation (no complex maths, just what matters)
The key metrics that drive your nest egg calculation (no complex maths, just what matters)
Think of your retirement pot not as a pile of cash, but as a machine designed to fill a specific gap. The size of that machine depends on three simple numbers. Get these right, and you stop worrying about mythical £1m targets.
First: your withdrawal rate. This is the percentage of your pot you plan to spend each year. Industry research typically bands a safe starting assumption between 3.7% and 4%. It is not a law — it is a temperature check. Do the arithmetic: a £200,000 pot at 4% gives you £8,000 a year; at 3.7% it gives £7,400. The difference of £600 a year might not sound huge, but over 30 years it compounds into a significant margin of safety. The 4% rule assumes your investments grow enough to replace what you take, adjusted for inflation. If you are cautious, start at 3.7% and see how your Retirement Calculator responds when you stress-test market downturns.
Second: the bridge-to-state-pension gap. The full new State Pension for 2025-26 is £230.25 a week, or £11,973 a year. That is your income floor — the government already guarantees it. But if you retire at 60 and cannot access the state pension until 67, your pot must cover seven years of full spending from scratch. That means every pound you need before 67 must come from your own savings. The smaller the gap between your desired spending and the state pension, the smaller your required pot. For early retirees, this bridge period is often the most expensive phase of retirement — once the state pension kicks in, the pressure on your pot eases dramatically.
Third: the tax efficiency ratio. This is the one metric that can effectively increase your usable pot by 10-20% without saving another penny. It measures how much of each £1 you withdraw actually lands in your pocket. ISA withdrawals are clean — 100p per £1, no tax. SIPP withdrawals work differently: you get 25% tax-free upfront, but the remaining 75% is taxed as income. In practice, a basic-rate taxpayer keeps roughly 75p from every £1 withdrawn from a SIPP. GIA (General Investment Account) withdrawals are where your personal £3,000 capital gains tax annual exempt amount and £500 dividend allowance for 2026/27 actually get used up — anything above those thresholds gets clipped. The order you tap these accounts matters enormously. Draw from your ISA first to keep your taxable income low, then use your SIPP once the state pension has filled the lower tax band. A tool like ARIA PM can sequence this drawdown order automatically, handling the survivorship adjustment and cost modelling so you can see the real usable income from each wrapper. Understanding which pound comes from where is often the difference between a pot that looks big on paper and one that actually works — similar to how the Calmar Ratio Calculator helps you compare risk-adjusted returns rather than just raw growth.
Common mistakes UK investors make when sizing their retirement pot — and how to dodge them
You’ve checked your pension forecast and plugged numbers into a calculator, but if you’re making any of these five common mistakes, your target pot could be thousands of pounds off — either leaving you short in retirement or causing you to save more than you actually need.
Mistake 1: Assuming you’ll receive the full State Pension without verifying your National Insurance record. The full new State Pension for 2026-27 is £12,547.60 a year — a meaningful floor that dramatically reduces the pot you need from your own savings. Yet 33% of defined contribution pension holders have under £10,000 saved, and many of those same people have gaps in their NI record from career breaks, low earnings, or living abroad. If you assume £12,500 and only qualify for £9,000, your private pot must cover an extra £3,500 every year — roughly £88,000 at a 4% withdrawal rate. Fix: Check your State Pension forecast on GOV.UK today, and consider buying voluntary NI years to fill gaps.
Mistake 2: Ignoring housing costs when you size your pot. The Pension Policy Institute’s 2026 report confirms that renters face materially different retirement risks than homeowners, because the Retirement Living Standards explicitly exclude housing costs. A homeowner needing £24,000 a year might only require a pot of £287,000 once the State Pension fills the gap — but a renter paying £800 a month needs an additional £9,600 annually from savings, pushing the required pot to over £527,000. That’s not a minor tweak; it’s a doubling of your target. Fix: Separate your expected housing costs from your lifestyle spending, and add the net present value of 25 years of rent to your pot calculation.
Mistake 3: Using the 4% rule blindly without stress-testing for sequence-of-returns risk. The famous 4% withdrawal rule assumes a balanced US portfolio over 30 years, but Morningstar’s 2025 research put a more cautious starting withdrawal rate at 3.7% for a 30-year retirement with a 90% probability of success, and its later 2026 analysis cited 3.9% under revised assumptions. If you retire at 60 with £500,000, draw 4% (£20,000), and the market drops 20% in year one, your portfolio falls to £384,000 while you’re still taking £20,000 — a 5.2% effective rate that accelerates depletion. Sequence risk can destroy a plan that looks fine on paper. Fix: Stress-test your plan with a 3% initial withdrawal rate and run it against historic bear markets.
Mistake 4: Forgetting that the £2,000 salary sacrifice cap arrives in April 2029. High earners currently use salary sacrifice to boost pension contributions while saving National Insurance. From April 2029 the National Insurance exemption on employee pension contributions made through salary sacrifice is capped at £2,000 a year. If you sacrifice well above that today, the NI saving on the excess disappears — reducing your net contribution, or pushing you towards a Relief at Source arrangement. Fix: Adjust your salary sacrifice assumptions to account for the cap, and model the post-2029 contribution drop.
Mistake 5: Treating all pensions the same when life circumstances differ dramatically. The DWP’s Analysis of Future Pension Incomes 2025 estimates 43% of working-age people — 14.6 million — are undersaving. But the gap is particularly stark for women: uncrystallised private pension wealth — the accumulated fund not yet accessed — shows women in their late 50s have a median of just £81,000, compared to £156,000 for men, a 48% gap. A woman with a smaller pot facing fewer working years, lower State Pension entitlement from caring responsibilities, and longer life expectancy needs a completely different drawdown strategy, not a one-size-fits-all multiple of salary. Fix: Do joint planning if partnered, model the lower earner’s gaps first, and prioritise building the smaller pot rather than both pursuing equal targets.
The hard truth is that your retirement pot isn’t a magic number you guess at — it’s a dynamic calculation based on the gap between your spending and the State Pension floor, the order in which you draw from ISAs, SIPAs, and general investment accounts, and your specific housing situation. ARIA PM handles survivorship adjustment, cost modelling, and regime stress-testing automatically — so you can focus on interpreting results rather than building the simulation. But first, fix these five mistakes, and you’ll already be ahead of most UK savers.
Your action plan today: three steps to size your nest egg with confidence
Your action plan today: three steps to size your nest egg with confidence
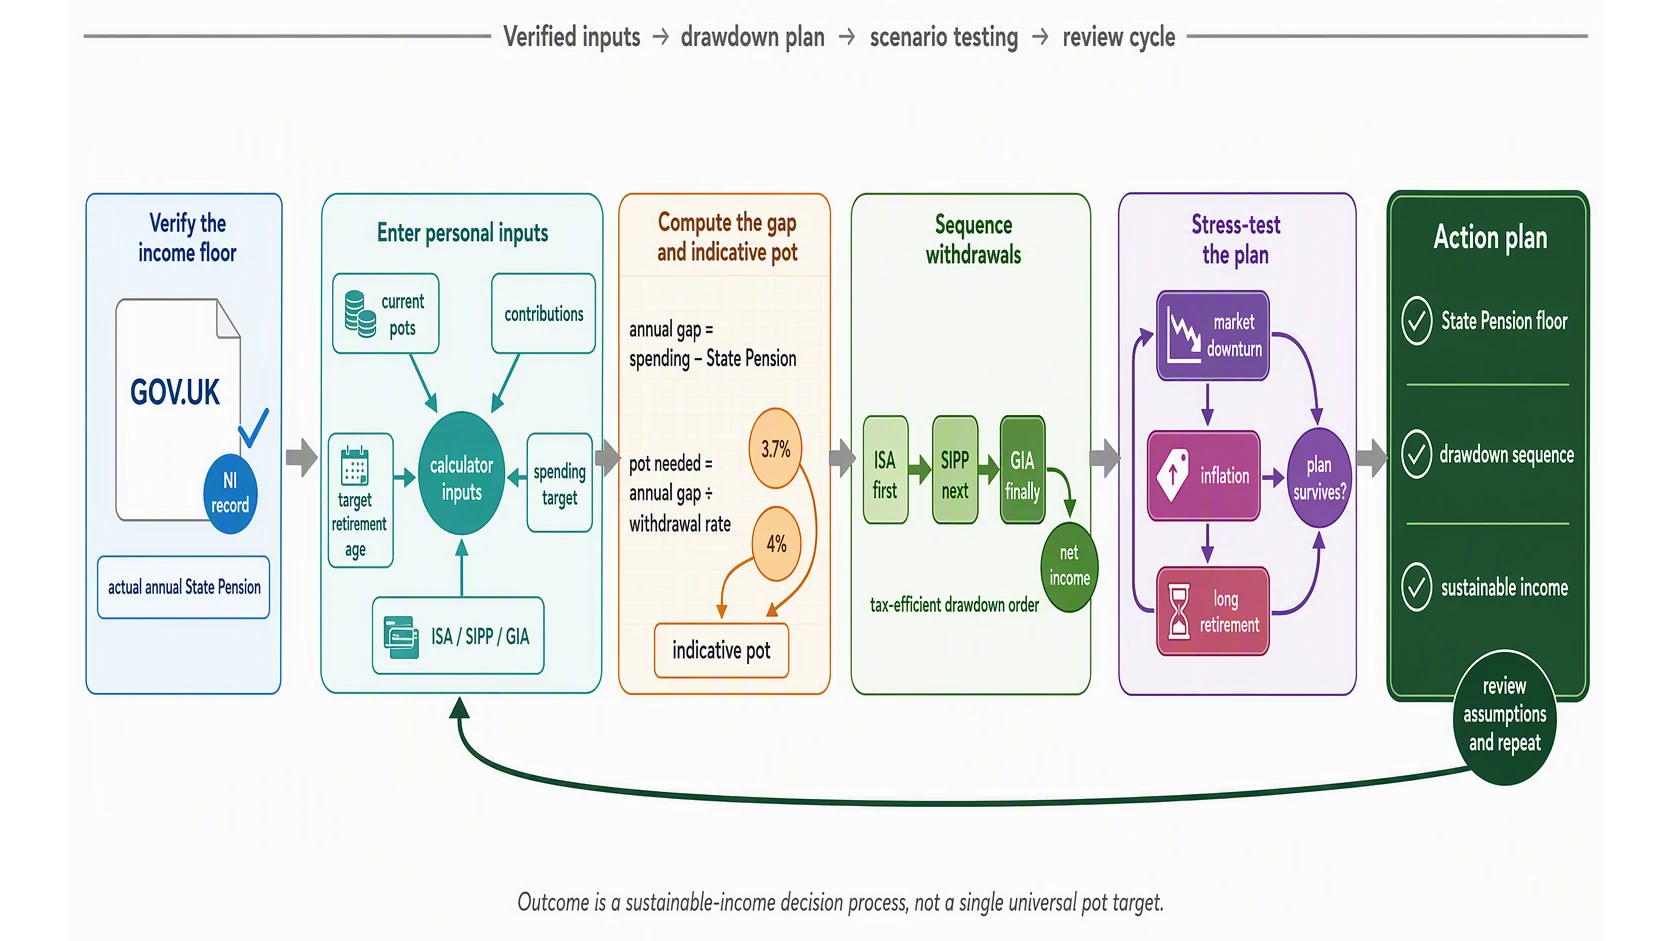
Step 1: Secure your state pension forecast. This is your financial floor — the single most important number you'll work with. Visit gov.uk/check-state-pension and request your forecast. The current full new state pension is £241.30 per week, but many people receive less due to gaps in their National Insurance record. Deferring your State Pension adds 1% for every nine weeks deferred — just under 5.8% across a full 52 weeks — and that uplift applies to the pension actually due, not necessarily the headline rate. Once you have your figure, multiply it by 52 to get your annual guaranteed income. Write it down: this is the amount your pot does not need to cover.
Step 2: Run the numbers through a free calculator — but apply the tax wrapper lens manually. Use a tool like Vanguard UK's retirement calculator or PensionBee's version. Input your current pots, contributions, and target retirement age. Run the figures twice: once assuming you draw from your ISA first (tax-free, and the most flexible wrapper), then from your SIPP (taxable but with a 25% tax-free lump sum). This sequencing dramatically changes how much your pot needs to deliver. Industry research from the Pensions and Lifetime Savings Association puts a moderate retirement at £32,700 a year for a single person and £45,400 for a couple, and a comfortable one at £45,400 and £62,700 — but Pensions UK estimates only 23% of working people are on track for Moderate and 9% for Comfortable, against 82% for the Minimum standard. The gap is where your pot lives.
Step 3: Apply a sustainable withdrawal rate and calculate the gap. Even Morningstar’s current estimates are assumptions-based: its 2025 research cited a 3.7% starting rate for a 30-year retirement with a 90% probability of success, while its 2026 analysis updated to 3.9% under revised assumptions. Take your total pension and investment pot, multiply by 0.037, and compare that annual income to your spending target minus your state pension. The shortfall (or surplus) is your true pot size question. This is where a free platform like ARIA PM becomes invaluable — it handles survivorship adjustment, cost modelling, and regime stress-testing automatically, so you can focus on interpreting results rather than building the simulation.
Your immediate checklist:
- (a) Check your National Insurance record on GOV.UK and identify any voluntary contribution gaps before the deadline to fill them
- (b) Consolidate old pensions using the Pension Dashboard — 85% of records are now available as of July 2026, making this far simpler than digging through old paperwork
- (c) Review your employer's matching contribution: many workers in workplace pensions (82% of employees are enrolled) still don't maximise their match, leaving free money on the table
- (d) If you're self-employed, consider a SIPP for flexibility and control over fund choice — currently 80% of self-employed people don't save in a private pension, despite having no employer scheme to rely on
The right pot size is the one that bridges your gap — not an intimidating headline number. Once you've seen how much the state pension already covers, and how tax-efficient drawdown sequencing shrinks what you actually need to save, the task becomes measurable, manageable, and genuinely achievable.
Key Takeaways
- Your retirement 'pot' is not a pile of cash but a dynamic liability-matching engine: its correct size depends on the gap between your target spending and the state pension floor, not your total desired income.
- The full new State Pension for 2026-27 guarantees £12,547.60 per year, which means a £30,000 spending goal requires funding only the £17,450 gap from your own savings.
- Drawing from your ISA first (tax-free), then your SIPP (25% tax-free lump sum plus taxable income), and finally your GIA minimises the taxable income you extract each year.
- Tax-efficient sequencing lets a smaller pot stretch further by maximising tax shelters and reducing the annual income you declare to HMRC.
- Industry DWP research confirms that ignoring the state pension floor and withdrawal order leads investors to overestimate their required pot size by a significant margin.
| Aspect | Traditional "Lump Sum" View | Dynamic "Liability-Matching" View |
|---|---|---|
| What your pot is | A fixed pile of cash you draw down until it runs out | A machine to fill the gap between your spending and guaranteed state income |
| Key question answered | "How much do I need to save?" | "How do I sequence withdrawals from ISA, SIPP and GIA to minimise tax?" |
| State pension role | Often ignored or treated as a bonus | The financial floor — your pot only needs to cover spending above this guaranteed income |
| Impact of tax wrappers | One blended return assumption | Tax-efficient sequencing dramatically shrinks the required pot size |
| Risk of miscalculation | Likely to over-save or under-save by tens of thousands | More accurate because it accounts for timing and order of withdrawals |
| Typical outcome | Chasing headline numbers like £500k or £1m | A smaller, more achievable pot target that works harder |
Common Mistakes vs. Correct Approach When Sizing Your Pot
| Common Mistake | What Investors Typically Do | The Correct Approach | Why It Matters |
|---|---|---|---|
| Ignoring the state pension floor | Calculate pot based on full spending target | Subtract state pension from annual spending first, then size the pot for the remainder | Your pot could be 30-50% smaller than you think |
| Tapping the wrong wrapper first | Withdraw from SIPP or GIA first | Take tax-free cash from ISA, then taxable income from SIPP up to your personal allowance | Saves thousands in unnecessary tax over retirement |
| Using a single withdrawal rate (e.g. 4%) | Apply one flat percentage to the total pot | Vary withdrawal rates based on wrapper type and tax bands | Avoids running out of money or paying too much tax |
| Forgetting to forecast state pension age | Assume state pension kicks in at 65 | Use your actual state pension age (currently 66-68 depending on birth year) | A 3-year gap could mean an extra £50k needed in your pot |
| Treating GIA like an ISA | Ignore capital gains tax and dividend tax in withdrawal planning | Sequence: use ISA first, then GIA (harvesting gains within allowance), then SIPP | Prevents a big tax bill when you need the money most |
Sources
- Analysis of Future Pension Incomes 2025 - GOV.UK — Analysis of Future Pension Incomes 2025 - forecasts future state and private pension income levels.
- Household total wealth in Great Britain - Office for National Statistics — Household total wealth in Great Britain - breaks down pension wealth and other assets for UK households.
- ons.gov.uk — PDF of ONS total wealth bulletin - detailed data on pension savings and net financial wealth.
- Analysis of Automatic Enrolment saving levels - GOV.UK — Analysis of Automatic Enrolment saving levels - typical workplace pension contribution rates and savings trends.
- Employee workplace pensions in the UK - Office for National Statistics — Employee workplace pensions in the UK - participation rates and average pension contributions by employees.