

You’re juggling accounts across AJ Bell, Vanguard, and a SIPP from Interactive Investor, yet your free portfolio tracker shows only one of them, caps your holdings at fifteen, and ignores your ISA tax status entirely. That’s not a tool — that’s a sales funnel dressed in green bars. Without a unified, tax-aware view, you can’t rebalance properly, you’ll likely trigger unnecessary capital gains, and each manual check wastes time you’d rather spend on actual decisions. This article answers a plain question: what does the Best Free Portfolio Tracker UK actually give you without paying? We’ll cut through the marketing, show you exactly what “free” means in practice, and reveal the one platform — like ARIA PM — that treats your whole portfolio as a single system from day one. No coding. No jargon. Just a fifteen-minute plan to take control.
What actually counts as a 'free portfolio tracker UK' — and what's just a sales funnel
If you searched “free portfolio tracker UK” and landed on a tool that only lets you track 10 holdings, you haven’t found free — you’ve found a trial. That distinction is the single most important thing to understand before you sign up. The market for portfolio tracking has grown fast as UK self-directed investors have surged. The number of UK adults using a non-advised investment platform rose from 5.9% in 2020 to 11% in 2024 — an increase of roughly 86% — while 3% of UK adults now use a trading app, with 47% of those users aged 18-34. But the tools that serve you and those that upsell you look identical at first glance.
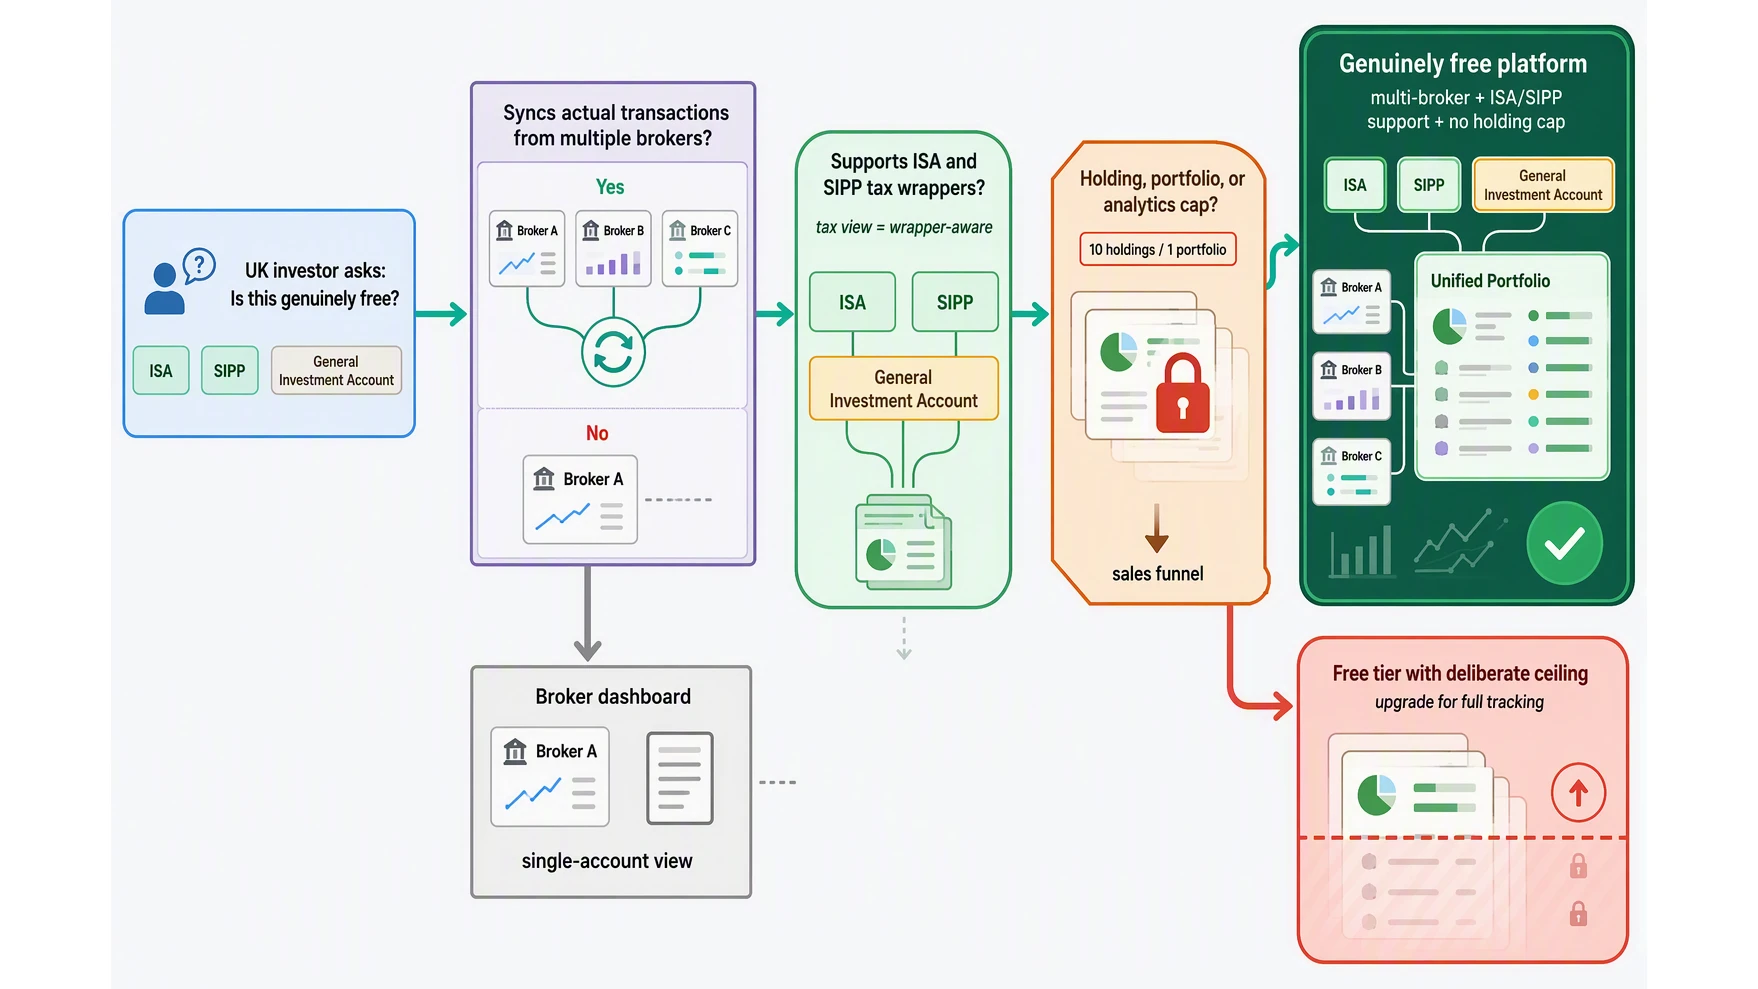
A genuinely free portfolio tracker does three things: it syncs your actual transactions from multiple brokers (not just a watchlist), it handles UK tax wrappers like ISAs and SIPs accurately, and it gives you real performance data without capping how many holdings or accounts you can add. It treats your portfolio as a single, coherent system from day one. ARIA PM, for example, was built this way — it carries no charge, no holding limits, and no hidden paywalls for multi-broker aggregation or UK tax reporting.
The freemium model works differently. Platforms like Sharesight offer a free tier, but it caps you at ten holdings and one portfolio. For a UK investor managing an ISA at one broker and a SIPP at another — not an unusual setup given how many platforms waive platform fees only above certain balances — that cap is a deliberate ceiling. Industry research shows Sharesight has over 600,000 investors, yet its free tier deliberately restricts the very features you need for real portfolio rebalancing or tax-aware decision-making. Delta by eToro, which reports more than 5 million users, offers unlimited account connections on its free version, though it limits how many assets you can fully view. getquin, which tracks over €20 billion, states that its core tracker is free and sells a Premium version alongside it. Both still sit inside a broader freemium business model that may gate risk analytics or dividend reporting.
The honest market structure has three kinds of “free”: broker dashboards that only see that one broker’s accounts; free tiers of paid trackers that cap holdings, portfolios, or tax reporting; and genuinely free tools that give you everything from the start. If you are managing a real portfolio across multiple brokers and UK tax wrappers, you do not want to discover three months in that your “free” tool cannot handle your Asset Allocation Calculator for ISA and SIPP target mix or your dividend tax calculations. The difference isn’t price — it is whether the tool is designed to serve your decision-making or designed to sell you the next tier.
Why a free portfolio tracker matters more than your broker's built-in tool
Your broker’s dashboard is not a portfolio tracker — it is a receipt. It shows you what you bought and sold inside that one account, but it tells you nothing about your total financial picture. With 15 million adult ISA accounts receiving £103 billion in subscriptions in the 2023-24 tax year — up 44% year-on-year — the average UK investor now holds money across at least two platforms. The FCA has documented that non-advised platform use nearly doubled between 2020 and 2024, meaning millions of us are managing our own money without an adviser stitching the pieces together.
The practical cost of this fragmentation is what you might call “portfolio blind spots” — and they can hit your pocket directly. Imagine you hold the same FTSE 100 stock in both a General Investment Account and an ISA. Your broker’s built-in tool shows you the current price, but it does not combine the two lots to give you a blended cost basis. That matters because when you sell from the taxable account, your Capital Gains Tax calculation depends on knowing the true average purchase cost across all holdings — including the ones inside the tax wrapper where gains do not count. Without a multi-broker tracker, you cannot see your real gain or loss per share. You are guessing. And with the annual CGT exempt amount now just £3,000, guessing wrong can mean overpaying tax.
A genuinely free portfolio tracker that integrates multiple brokers fixes this. It gives you one screen showing all your accounts — ISAs, SIPPs, and taxable dealing accounts — alongside accurate dividend tracking across every wrapper. That single-view net-worth figure matters more than you might think: the UK household-sector net worth is estimated at £10.8 trillion, but you need a tool to see your own slice of that number. Without it, you are making asset-allocation decisions — whether to tilt toward UK equities or international exposure — based on incomplete data. You could be unintentionally overweight in one sector because your broker’s view only shows half your portfolio.
Tools like ARIA PM’s free platform treat your holdings as one tax-aware system from day one. There are no holding limits, no paywalled tax wrapper support, and no cap on the number of brokers you connect. That Portfolio Calculator runs on live data from every account you add, giving you risk analytics and dividend reporting without demanding your credit card. The difference between “free” and “free to start” is the difference between a tool designed to serve you and one designed to sell you — and for a UK investor managing multiple ISAs, that distinction is worth real money.
How a free portfolio tracker actually works — no jargon, just the steps
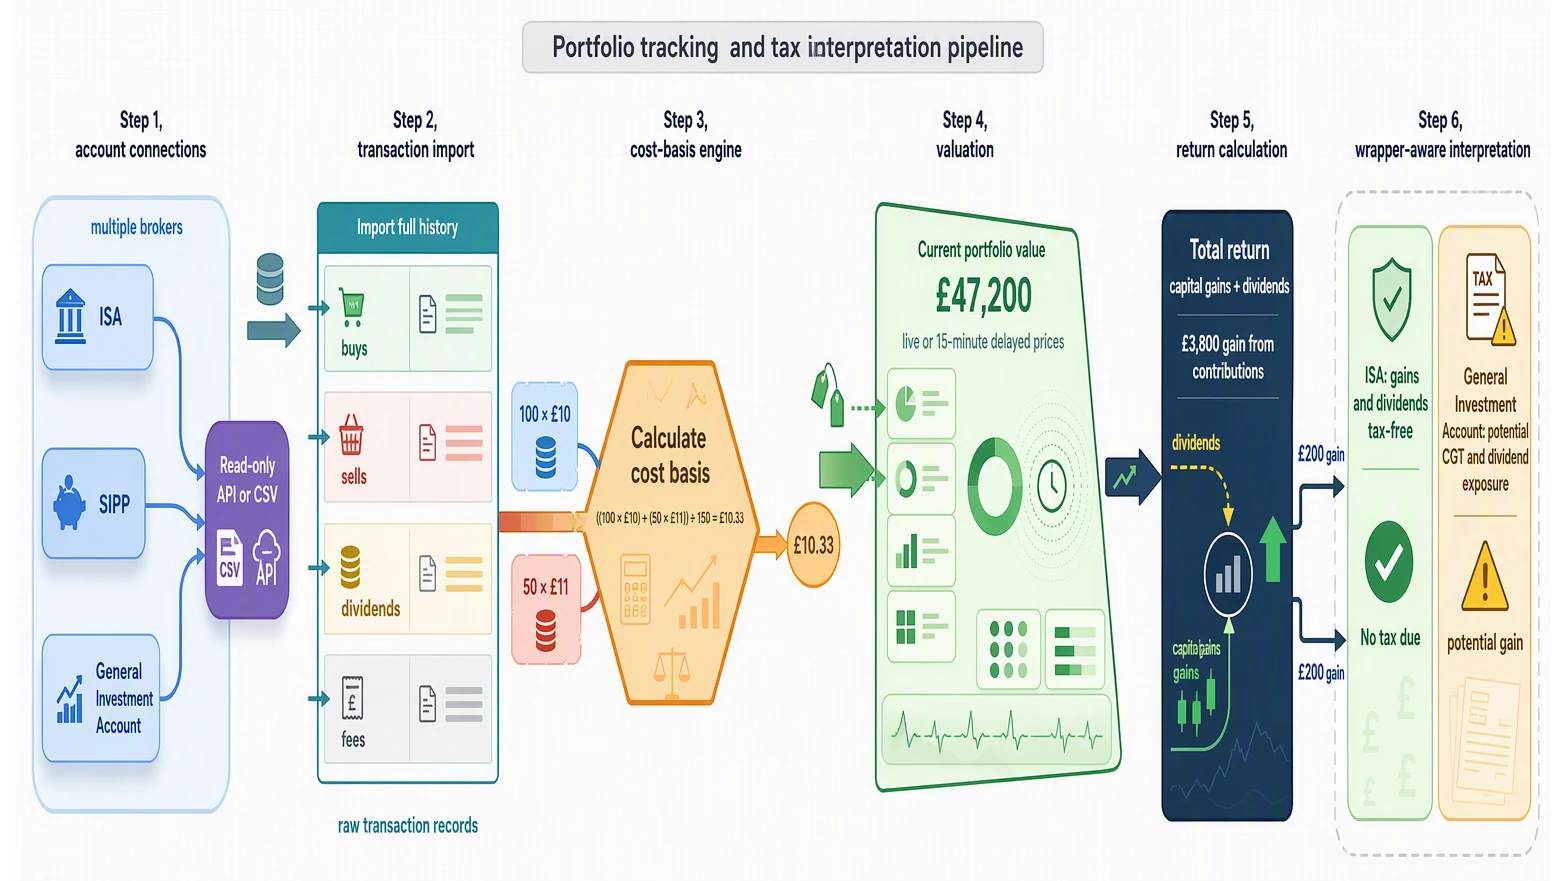
First, you connect your accounts. Most genuinely free trackers use read-only API connections or secure CSV uploads — meaning they can see your holdings but can’t trade. A tool like Delta by eToro supports unlimited connections, and getquin supports more than 800,000 assets, while Portseido advertises coverage of more than 70 exchanges. You add each broker: your ISA with Hargreaves Lansdown, your SIPP with AJ Bell, your General Investment Account with Vanguard. The tracker pulls your positions into one screen.
Second, it imports your full transaction history — buys, sells, dividends, fees. From that, it calculates your cost basis: the average price you paid, adjusted for stock splits, return-of-capital events, and reinvested dividends. If you bought 100 shares of a FTSE 100 ETF in your ISA at £10 each and later bought 50 more at £11, the tracker knows your average cost is £10.33 — and it updates that number automatically when dividends are reinvested.
Third, it shows your current portfolio value in real time, using live or 15-minute delayed prices. No manual spreadsheet entry. You open the app and see: “Portfolio currently worth £47,200 — up £3,800 from total contributions.”
Fourth, it calculates your total return — capital gains plus dividends — as a percentage. This is where the tax wrapper logic matters. A good UK free tracker automatically knows an ISA is tax-free, a General Investment Account is taxable, and a SIPP sits in a different category altogether. It won’t mix them up or show you misleading ‘tax-adjusted’ returns. So if those same FTSE 100 ETF shares are now at £12, the tracker shows you a £200 profit in your ISA and flags “No tax due.” If those shares were in a General Account, it highlights that same £200 as a potential gain for your self-assessment.
The whole process takes about 15 minutes to set up. After that, it updates automatically — no manual syncing, no digging through broker statements every month.
The catch? Many free tiers cap exactly these features. Sharesight, for example, restricts you to one portfolio and just ten holdings on its free plan. That ten-holding limit isn’t accidental — it’s designed to push you toward a paid subscription once your portfolio grows. By contrast, genuinely free tools like ARIA PM treat your portfolio as a single, tax-aware, multi-broker system from the start, with no holding caps and full ISA, SIPP, and GIA support. You get portfolio-level analytics — risk metrics, correlation calculators, Markowitz-style optimisation — without paying a penny.
If you’re managing a growing portfolio across multiple brokers and tax wrappers, the question isn’t whether to pay — it’s which free option actually gives you the tools for real decisions. You can explore the best free portfolio tracker UK options side-by-side, or try our portfolio calculator to see how your current mix stacks up without any commitment.
Real-world examples: what free trackers actually deliver for UK portfolios
Imagine you’re a typical self-directed UK investor. You hold a Vanguard ISA with a FTSE Global All Cap tracker, a Trading 212 SIPP loaded with US tech stocks, and a Freetrade General Account containing a handful of individual UK shares. Your broker dashboards each show you a neat, isolated picture — but none of them can see the others. So you have no single view of your total asset allocation. Open a genuinely free, multi-broker aggregator like getquin or ARIA PM, however, and the fog clears immediately. You see one portfolio: 60% equities, 20% bonds, 10% cash, 10% alternatives. The headline number? You’re 40% overweight on US tech. You rebalance in minutes, not hours. That single screen — total portfolio value, your top five holdings by size, and your trailing 12-month return — is exactly what a free tracker should deliver, and what the capped tiers of paid tools deliberately withhold.
Dividend tracking is another area where free tools prove their worth. With a tool like ARIA PM or getquin, a UK investor collecting dividends from 15 different stocks sees their entire income stream — say £1,200 per year — displayed in one place, with a forecast for next quarter’s payouts. Without it, you’re logging into each broker’s transaction history and manually tallying up. The pain compounds when you consider the tax paperwork: the 10% dividend tax credit was abolished in April 2016, so every dividend is simply net with no gross-up to calculate. A tool that tracks your actual receipts saves you hours of spreadsheet frustration.
Then there are cost-basis errors — a quiet hazard for active investors. Suppose you bought and sold the same ETF several times across two brokers. Your broker’s simplified ‘average cost’ figure might show a gain of £4,200, but a tracker with proper lot-level tracking reveals your true realised gain is actually £5,000. The £800 difference matters when the capital gains tax annual exempt amount is just £3,000 for 2026/27. A genuinely free platform that supports lot-level accounting ensures you report accurately and don’t accidentally overpay HMRC. Industry research shows that over £103 billion was subscribed to adult ISAs, an increase of £31.4 billion — with that much capital moving, accurate cost tracking is no longer a luxury.
The distinction between genuinely free tools and free tiers of paid products is stark. Sharesight, for instance, supports 700,000+ securities and 200 integrations, but its free tier only allows 10 holdings — you’d hit that limit with just an ISA and a SIPP. The genuinely free alternatives, like ARIA PM, handle 50+ holdings per portfolio with no cap, at no charge. Similarly, getquin — with over 500,000 users and €20 billion tracked — supports more than 800,000 assets, including GBP and London-listed tickers. So ask yourself this: do you want a free portfolio tracker UK tool that gives you the full picture, or one designed to sell you a subscription the moment your portfolio grows? The answer dictates which tool you download.
The critical features you must check before trusting a 'free' tracker with your data
Before you link your hard-earned ISA or SIPP to any "free" tracker, you need to check what exactly you are trading for that zero price. Many free tiers are designed to be a deliberate ceiling — they give you just enough to feel the product's value, then cap the exact features you need for genuine decision-making. Here are the critical features to verify before trusting any platform with your portfolio data.
Holding caps are the most common trap. Several prominent trackers limit you to 10 or 20 holdings on the free plan. If you have a diversified portfolio — say, 11 positions across an ISA and a SIPP — you must upgrade to see all of them in one view. This is unlimited basic tracking with a catch: you can log in and see a total figure, but the detailed view of each asset is restricted. Always check the small print for the maximum number of instruments before you start entering data.
Tax wrapper support is non-negotiable. Some free trackers treat every account as a standard taxable brokerage. This is a critical error for UK investors: it overstates your tax liability by showing dividends as taxable and gains as potentially subject to CGT, when in fact your ISA and SIPP are entirely tax-sheltered. A tracker that ignores ISA status will mislead you about your true, post-tax return — potentially by hundreds of pounds per year. For the 2026-27 tax year, with the ISA allowance at £20,000, running a portfolio incorrectly through a taxable lens could falsely suggest you owe dividend tax when you owe none.
Data accuracy and update frequency matter more than you think. Free tiers often rely on 15-minute delayed prices rather than live feeds. For a long-term buy-and-hold investor that is acceptable, but if you are rebalancing or preparing for a trade, a delayed price can show you a position is worth 5% more or less than it actually is — enough to trigger a bad decision. Check whether the tool offers live or delayed data for UK-listed tickers and GBP-denominated assets.
Security must not be an afterthought. The FCA’s Financial Lives survey reported that 47% of UK trading-app users were aged 18-34, an audience comfortable with digital tools but not always aware of data risks. Free trackers that require your broker login credentials (screen scraping) expose you to greater risk than those using read-only API tokens. A token can’t trade or withdraw — it simply reads your positions. If the tool demands your full password, ask yourself: what is the company’s actual business model? Many portfolio apps are fundamentally data companies; they may sell or license aggregated (or even de-anonymised) order-flow data. Read the privacy policy carefully.
Exportability is your escape route. Some free tools lock your transaction history behind a paywall — you can input years of trades, but once you want to leave, the only way to download a full CSV is to upgrade. Before you connect your accounts, confirm you can export your complete data set at any time without paying.
UK-specific tax handling is frequently broken. Many US-origin tools do not understand ISAs, SIPPs, or how UK Capital Gains Tax interacts with the bed-and-breakfasting rule. They may also incorrectly apply the abolished 10% notional dividend tax credit (removed in 2016) or mis-state CGT rates. For UK investors managing a portfolio with £3,000 annual CGT exempt gains (2026-27), this can produce wildly inaccurate tax estimates.
Before you connect your accounts, run this checklist: (1) no holding cap on your number of assets; (2) explicit ISA and SIPP tax wrapper support; (3) read-only connection via API, not screen scraping; (4) full data export available without paying; (5) positive reviews from UK investors on Trustpilot or investor forums. If a tracker fails any of these, it is not genuinely free — it is a sales funnel dressed as a tool.
Your 15-minute action plan to start tracking your portfolio for free today
Your 15-minute action plan to start tracking your portfolio for free today
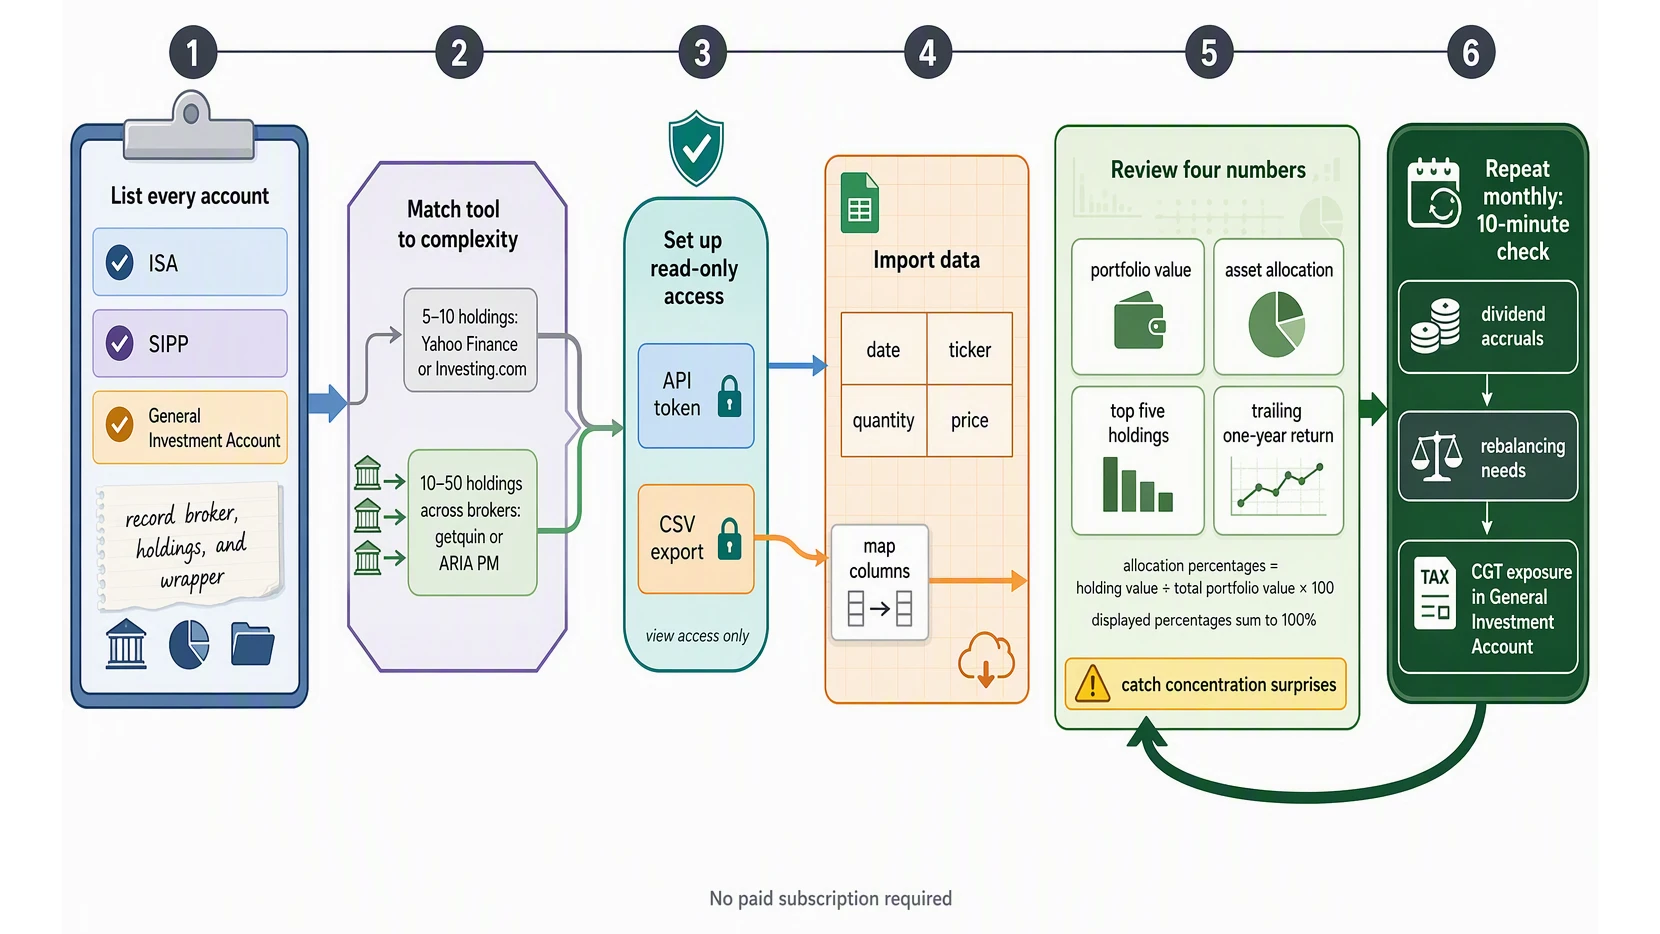
Step 1: List every account you own. Grab a piece of paper or a notes app. Write down each broker you use, the number of holdings inside each, and which tax wrapper each account uses — ISA, SIPP, or General Investment Account. If you hold the same stock in both an ISA and a General Account, separately too: the tax treatment is completely different (gains inside an ISA are tax-free). This list is the map of everything you need your tracker to see.
Step 2: Choose the genuinely free tracker that matches your reality. Be honest about complexity. If you have 5-10 holdings across one or two brokers, the free portfolio tools inside Yahoo Finance or Investing.com will work — they provide live prices (often real-time for UK and US stocks) and basic dividend tracking. But if you have 10-50 holdings spread across multiple brokers and wrappers, those free tiers will quickly frustrate you. For that scenario, use getquin or ARIA PM — both offer full multi-broker aggregation and tax wrapper support without a holding cap. ARIA PM specifically treats your ISA, SIPP, and General Account as one unified, tax-aware system from day one, handling dividend tracking and capital gains exposure automatically. You do not need a paid plan to see your true allocation.
Step 3: Set up read-only access. If your broker supports Open Banking or API tokens — Trading 212 and Freetrade both do — use that for instant, automatic syncing. If not, log in to each broker and download your transaction history as a CSV file. Most UK brokers offer this; look for “Export transactions” or “Download activity” in your account settings.
Step 4: Import your data. With CSV uploads, budget 30-60 minutes to map the columns (date, ticker, quantity, price) to the tracker’s fields. With an API connection, the process is instant — your holdings appear live. This is the single biggest time investment, but you only do it once.
Step 5: Review your dashboard. Look at four numbers first: your total portfolio value, your asset allocation by region and sector, your top five holdings, and your trailing one-year return. The goal is to catch surprises — a single stock that represents 20% of your portfolio when you thought it was 10%, or a fund that has quietly underperformed its benchmark. Use the Portfolio Diversification Calculator: Score Your Portfolio to see how concentrated you really are.
Step 6: Set a monthly 10-minute review reminder. At the start of each month, check for dividend accruals, rebalancing needs, and any capital gains exposure in your General Account. With ARIA PM, this becomes a single-screen check because the platform handles survivorship adjustment, cost modelling, and regime stress-testing automatically — so you can focus on interpreting results rather than building the simulation.
You do not need a paid subscription to know where your money is. These tools exist because the industry wants you to think you need to pay for clarity. You do not. Start today.
Key Takeaways
- The defining test of a genuinely free UK portfolio tracker is whether it lets you connect multiple brokers, track ISAs and SIPs correctly, and add unlimited holdings from day one — if it caps any of these, it’s a freemium sales funnel, not a free tool.
- Freemium trackers like Sharesight’s free tier deliberately limit you to ten holdings and one portfolio, which makes them useless for the common UK setup of an ISA at one broker and a SIPP at another, forcing you to pay to see your full picture.
- A truly free tracker treats your entire portfolio as a single, tax-aware system across all your brokers, so you can see real performance and rebalancing needs without hitting a paywall just for adding your second account.
- The surge in UK self-directed investors — up 86% since 2020 — means many are using free trackers that are actually designed to upsell you on the risk analytics, tax wrapper support, or holding limits you need for real decisions.
- Before signing up, check whether the tool syncs actual transaction history from your brokers (not just a watchlist) and handles UK tax wrappers accurately; if it doesn’t, the “free” option is just a deliberate ceiling to push you toward a paid plan.
| Feature | Genuinely Free (e.g. ARIA PM) | Free Tier of Paid Tools (e.g. Delta by eToro) | Built-in Broker Dashboard |
|---|---|---|---|
| Holding limit | Unlimited | Often capped (e.g. 10 holdings) | Unlimited (for that account only) |
| Multi-broker support | Yes, from the start | Limited or requires paid upgrade | No-single broker only |
| Tax wrapper awareness (ISA, SIPP, GIA) | Yes, treats portfolio as one system | Partial or requires manual workarounds | No-separate account views |
| Risk analytics | Included | Often locked behind paywall | Basic or absent |
| Intended purpose | A complete portfolio tracker | A sales funnel to upsell you | A transaction receipt |
| Data export & CSV upload | Yes, secure and unlimited | Often restricted or manual | Sometimes available per account |
Comparison Table 2: Real-World UK Portfolio-What Each Tracker Shows You
| Portfolio Component | Genuinely Free Tracker (e.g. ARIA PM) | Free Tier of Paid Tool | Broker Dashboard (Vanguard) |
|---|---|---|---|
| Vanguard ISA: FTSE Global All Cap tracker | Shows holding, weight, and tax wrapper type | Only works if under 10 total holdings-otherwise blocked | Shows only this ISA, no context |
| Trading 212 SIPP: US tech stocks | Included, full multi-broker view | May require manual CSV import or subscription to add | Not visible at all |
| Freetrade GIA: handful of ETFs | Included, aggregated with ISA and SIPP | Likely hits holding cap-upgrade needed | Not visible at all |
| Total portfolio value | Calculated across all 3 accounts | Partial or unavailable | Shows only Vanguard balance |
| Asset allocation across all accounts | Yes-single unified view | No-fragmented by account limits | No |
| Tax-adjusted performance | Yes (ISA vs SIPP vs GIA treated differently) | Rarely included in free tier | No |
Sources
- fca.org.uk — Financial Lives Survey 2024 key findings on UK consumer investment and savings behaviour.
- Commentary for Annual savings statistics: September 2025 - GOV.UK — Commentary on UK annual savings statistics, including ISA and DIY investment trends.
- National balance sheet estimates for the UK - Office for National Statistics — National balance sheet data showing UK household financial assets and liabilities.
- Stock Portfolio Tracker | Delta by etoro — Delta by eToro's stock portfolio tracker with real-time prices and performance analytics.
- Mutual Fund Tracker | Sharesight UK — Sharesight UK’s mutual fund tracker with dividend tracking and tax reporting.
- UK Portfolio Tracker — Portseido UK portfolio tracker offering multi-asset performance and benchmarking tools.