

You’ve spent months building your ISA and SIPP, only to open a portfolio tracker and find it showing your pension contributions as cash, with no option to mark the 25% tax-free lump sum. That single misstep makes your entire net worth picture wrong. A tracker that mishandles dividends or ignores your SIPP’s unique rules doesn’t just look messy — it hides the real performance of your investments and can lead to bad decisions. So, what is the Best Portfolio Tracker for ISA and SIPP? This article cuts through the marketing to compare UK-specific tools that get the tax wrappers right. You don’t need to be a developer — just a self-directed investor who wants accurate, actionable numbers.
What Is a Portfolio Tracker for ISA and SIPP — and Why It Matters for Your Wealth
Imagine trying to navigate a maze blindfolded — that is what managing your investments feels like without a portfolio tracker for ISA and SIPP. Today, 23% of UK adults — roughly 12.5 million people — actively invest in the stock market, up from 18% in 2023. The DIY investment market alone hit £572 billion by the end of 2025, growing 22% in a single year with over two million new accounts opened. Yet most investors still check their holdings across two, three, or even four different broker platforms, piecing together their total picture manually. That’s where a portfolio tracker for ISA and SIPP comes in.
In plain English, a portfolio tracker is a tool that consolidates all your investments — across ISAs, SIPPs, and even general investment accounts — into one clean dashboard. It shows you your total net worth, asset allocation, performance, and dividend income at a glance. Our free dividend calculator works the income side out on its own. No more logging into five separate apps to see if you’re properly diversified. Think of it as your personal financial command centre.
But here is the critical distinction most beginners miss: the best portfolio tracker isn’t the one with the prettiest charts. It is the one that correctly handles the unique tax rules of ISAs and SIPPs. Why does that matter? Because a tracker that misclassifies dividends — forgetting that they are tax-free inside an ISA, or that the dividend tax allowance is just £500 for 2026/27 outside it — will show you a misleading picture. Worse, a SIPP portfolio tracker that fails to account for the 25% tax-free lump sum you can withdraw at retirement (up to £268,275) will underestimate your future spending power. Every misstep silently adds hidden complexity to your planning, costing you more in missed insights than any subscription fee ever could.
This is especially urgent today, as investors increasingly hold multiple ISAs and SIPPs across different platforms. You might have a Stocks and Shares ISA with one broker, a Lifetime ISA elsewhere, and an old workplace SIPP you rolled into a provider years ago. A dedicated portfolio tracker for ISA and SIPP gives you a combined view across all those platforms — a benefit no single brokerage app can offer.
Without one, you are flying blind. You cannot calculate your true overall allocation, missing rebalancing opportunities that could improve risk-adjusted returns. You cannot see whether your portfolio is optimised for tax efficiency. A tool like the Portfolio Calculator can help test different scenarios, but the foundation is real-time consolidation of your actual holdings.
The central takeaway? A tracker that gets the tax wrappers wrong is worse than no tracker at all — it creates false confidence. The right one saves you from costly complexity, letting you focus on what matters: building lasting wealth.
How a Portfolio Tracker Actually Works: A Step-by-Step, Jargon-Free Guide
Let’s walk through what happens when you connect a portfolio tracker to your ISA and SIPP — no code, no finance-speak, just the mechanics.
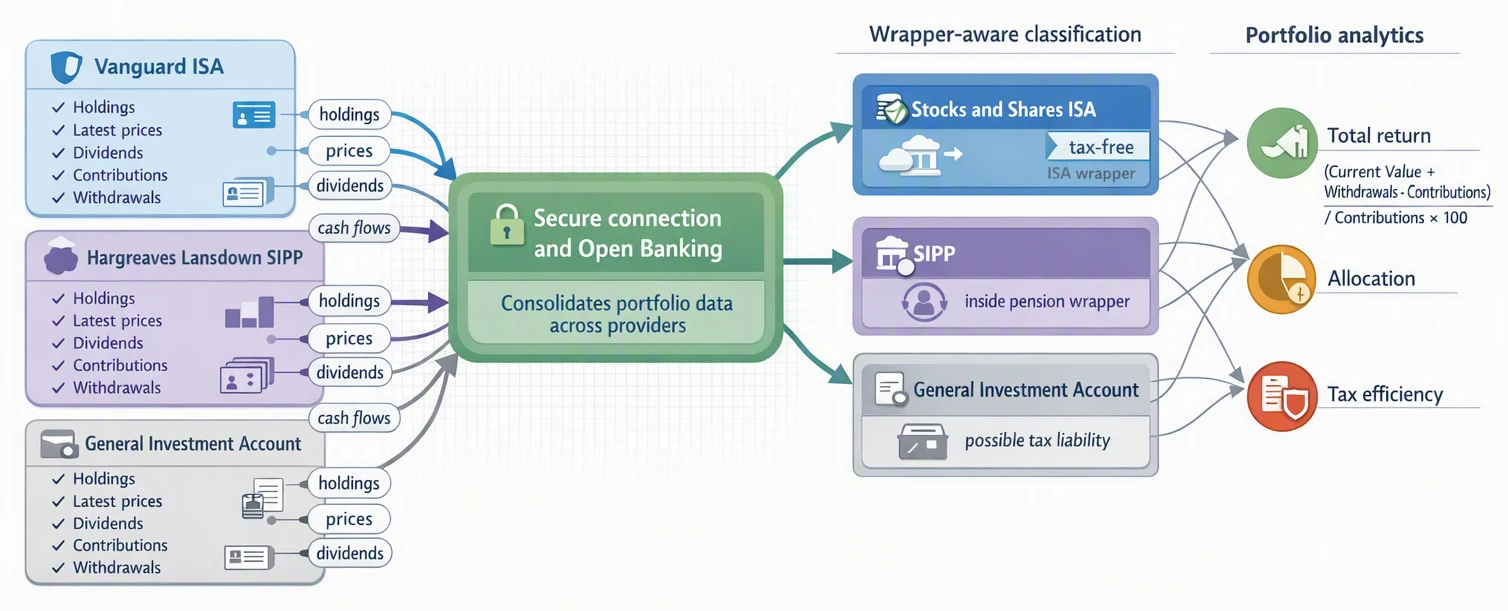
First, you link your accounts. This might be your Vanguard ISA or your Hargreaves Lansdown SIPP, or both. The tracker uses a secure connection (often via a service like Yodlee or TrueLayer) to pull in your holdings, the latest prices, any dividends paid, and your cash flows — contributions you’ve made and withdrawals you’ve taken.
Once the data is in, the tracker separates your accounts by wrapper. This is critical. A Stocks and Shares ISA and a SIPP look identical on the surface (they both hold shares and funds), but the tax rules are completely different. The tracker must know that dividends inside an ISA are tax-free, while dividends inside your SIPP are still inside the pension wrapper — they don’t get taxed until you draw them, and then different rules apply. By early 2024, total Stocks and Shares ISAs were worth £511 billion, with 4.1 million accounts subscribed in 2023/2024. The SIPP market sat at roughly £500 billion, with two-thirds of those accounts managed without a financial adviser. That’s a lot of money riding on correct classification.
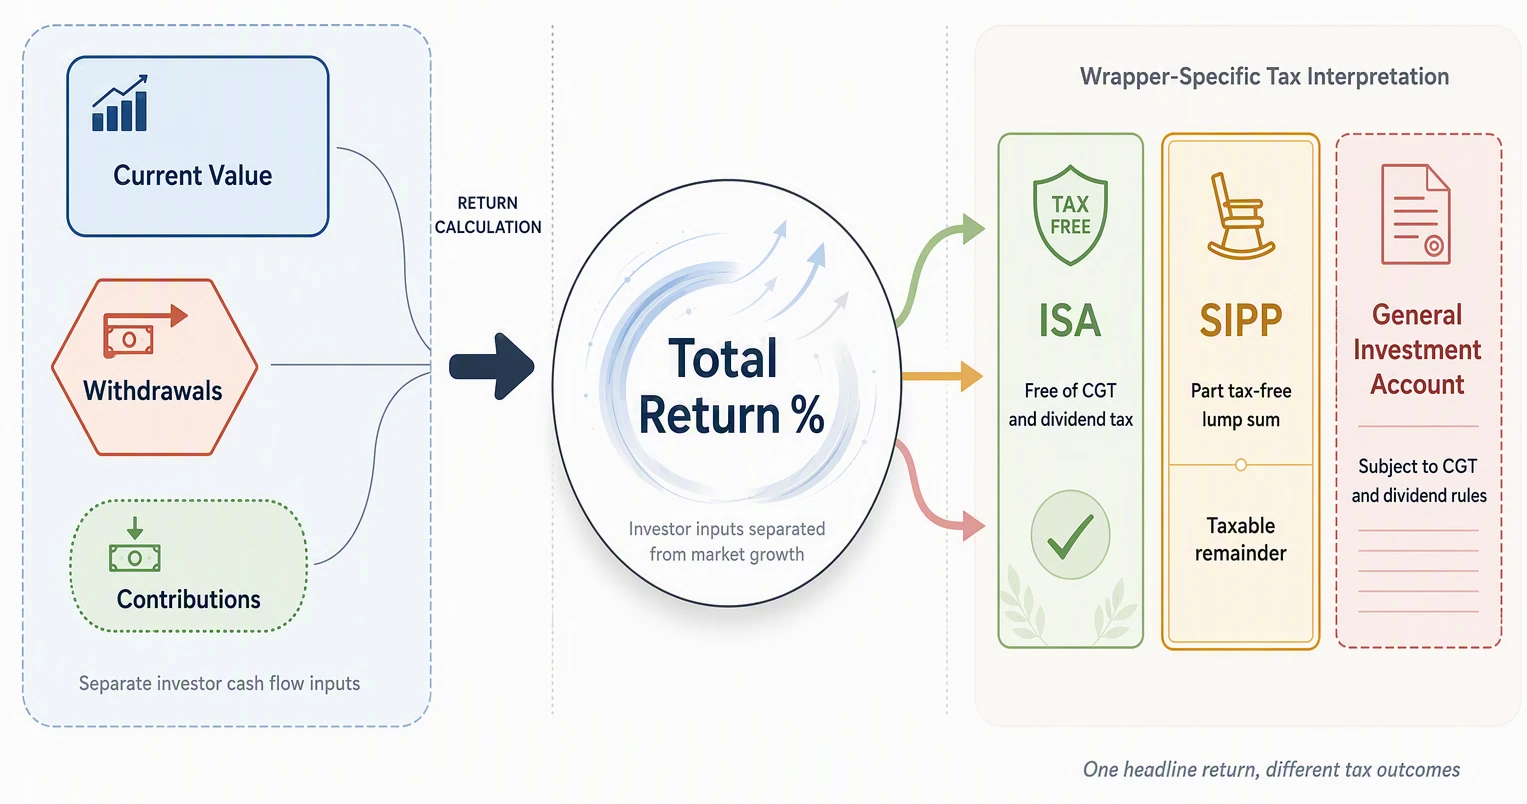
The tracker then calculates your total return. Here’s the simple formula it uses:
Total Return = (Current Value + Withdrawals - Contributions) / Contributions × 100
So if you put in £20,000, your holdings are now worth £24,000, and you’ve taken £1,000 out, you get: (24,000 + 1,000 - 20,000) / 20,000 × 100 = 25%. That’s your real return — adjusted for what you’ve added or taken out.
Next, the tracker shows your allocation — what percentage is in UK equities, global bonds, cash, etc. — and your tax efficiency. For example, it estimates how much tax you’ve saved by holding dividend-paying shares inside your ISA versus a general account. The UK DIY investment market reached £572 billion by the end of 2025, up from £468 billion — growth of 22% — with over 10.2 million customer accounts. This is mainstream, not niche.
For SIPP tracking specifically, a good tool accounts for the 25% tax-free lump sum you can take from age 55 (rising to 57 in 2028). It shouldn’t treat your entire SIPP value as spendable — only 75% is taxable on withdrawal. A tracker that ignores this gives you a misleading picture of your actual retirement income. Some trackers also factor in costs like the 0.5% Stamp Duty Reserve Tax on UK share purchases, which nibbles away at returns.
Finally, the tracker lets you run scenarios — using tools like a ROI Calculator or a Compound Interest Calculator — to test “what if I increase my ISA contributions by £200 a month?” or “what if my SIPP returns 6% rather than 8%?” ARIA PM handles survivorship adjustment, cost modelling, and regime stress-testing automatically — so you can focus on interpreting results rather than building the simulation.
The bottom line: a tracker that correctly handles your ISA and SIPP wrappers is worth far more than one with flashy charts that gets the tax wrong. Misclassify dividends or ignore the tax-free lump sum, and you lose the whole point.
Top ISA and SIPP Portfolio Trackers Compared: Real Tools, Real Costs
Of all the features a portfolio tracker can offer — fancy charts, rebalancing alerts, correlation heatmaps — the single most important job for a UK investor is getting tax wrappers right. A tracker that treats your ISA and SIPP as generic pots will mislead you on what you actually own, owe, and can withdraw. The best tools handle the UK’s specific wrapper rules natively.
Take Sharesight — it explicitly supports UK tax wrappers, letting you tag each account as a “Stocks and Shares ISA” or “SIPP.” It then applies Section 104 share pooling to your trades. This is crucial for accurate Capital Gains Tax (CGT) reporting on any investments held outside a tax wrapper, because HMRC requires you to average the cost of identical shares across all purchases in a single “pool” rather than tracking them individually. Sharesight does this automatically. It also enforces the bed-and-breakfast rule — if you sell a share and repurchase it within 30 days, HMRC treats the sale as never having happened for CGT purposes. Sharesight flags that immediately, which can save you a nasty surprise at self-assessment time. If your priority is dividend forecasting rather than CGT reporting, Best Snowball Analytics Alternative for UK Investors compares that category on UK tax-wrapper handling rather than on forecast charts.
For budgeting-focused investors, Moneyhub or Yolt connect to your bank and broker accounts via Open Banking. They give you a dashboard of your total net worth, including ISA and SIPP balances. However, neither applies Section 104 pooling nor enforces the bed-and-breakfast rule. They show you where your money is, but not what your tax liability is — which matters when you sell outside your ISA or SIPP.
The built-in trackers on platforms like Interactive Investor and AJ Bell are competent for checking daily prices and contribution limits. But they rarely show you a unified view if you hold accounts across multiple providers — a common scenario as £872 billion now sits in UK ISAs alone (a 20.1% rise in a single year by April 2024).
Real scenario: Imagine you have a Vanguard ISA (holding a FTSE All-World tracker) and a Hargreaves Lansdown SIPP (holding UK equities and a global bond fund). A good tracker like Sharesight lets you assign both accounts, then calculates your total portfolio return including the 25% tax-free lump sum on the SIPP — it assumes 25% of the SIPP value is withdrawable tax-free from age 55 (rising to 57 on 6 April 2028). It separates ISA gains (tax-free) from SIPP gains (taxable on withdrawal beyond the lump sum). A generic tracker would lump them together, showing a misleading “net return” that ignores the SIPP tax treatment entirely.
With the average Stocks and Shares ISA deposit at £7,594 in 2023/24 and SIPP withdrawals reaching £18.6 billion in 2024/25, the cost of getting this wrong is real — not in fees, but in missed insights and compliance headaches. Choose a tracker that understands UK wrappers, not just prices.
Want to model how different withdrawal strategies affect your outcome? The ROI Calculator can show the impact of SIPP tax treatment on long-term growth, and the Sharpe Ratio Explained: A UK Investor's Guide helps you compare risk-adjusted returns across your wrappers.
The Key Metrics a Tracker Must Get Right for ISAs and SIPPs
Before the list: a tracker measures what you own. A screener ranks what you might buy — a different tool for a different question, and one worth keeping separate in your head. Best Stockopedia Alternative for UK Investors covers the screening side; everything below is about the tracking side.
When your tracker misreads the rules of a Stocks and Shares ISA, the error isn't just cosmetic — it's financial. Consider this: industry data shows that approximately £511 billion (58.6%) of all ISA savings sits in Stocks and Shares ISAs, with total subscriptions hitting an all-time record of £103 billion in 2023/24. The SIPP market is similarly vast, hovering around £500 billion. A tracker that treats the income inside these wrappers the same as a general investment account is giving you a map that has the wrong roads drawn on it. Here are the metrics that matter — and why wrapper handling is non-negotiable.
Total portfolio value sounds simple, but many tools aggregate holdings without separating your ISA from your SIPP from your general account. That aggregate number is worse than useless — it hides the fact that your SIPP drawdown strategy depends on knowing exactly how much is in the taxable vs. tax-protected pot. Asset allocation by wrapper is the real insight. If your tracker lumps them together, you might think you are 60% equities when you are actually 70% equities in your SIPP and 50% in your ISA — a distinction that matters enormously for rebalancing decisions and risk management.
Return since inception must be money-weighted (MWR) , not just time-weighted. As noted in ****, MWR accounts for the timing and size of your cash flows, which is critical when comparing an ISA you drip-feed monthly with a SIPP you topped up with a single bonus payment. A tool that uses simple time-weighted return will make the SIPP look unusually good or bad depending on when you added cash, misleading you about the actual performance of your manager or strategy.
Yield on cost is the metric that reveals the true compounding power of a well-run ISA. Because dividends inside an ISA never incur tax, the reinvested growth is unbroken. A tracker that treats all dividends as taxable — many do, assuming a general account — has to be avoided. Correct handling matters here.
Taxable vs. tax-free income is the most commonly botched metric. The 10% notional dividend tax credit was abolished in April 2016 , so no gross-up should appear. Inside an ISA, gains and dividends are completely free of Capital Gains Tax (CGT) and income tax — the CGT annual exempt amount of £3,000 (2026/27) does not even apply inside an ISA. For a SIPP, the tracker must show the 25% tax-free lump sum as a separate component, not simply state the total pension value. Many investors overestimate their accessible retirement income because their tracker fails to isolate that tax-free entitlement.
A tracker that ignores these wrappers leads to poor decisions — over-withdrawing from a SIPP, misallocating risk, or failing to prioritise ISA contributions. Tools that generate HMRC-ready tax reports with automatic dividend matching and tax year summaries are the benchmark, because they prove the tool understands the wrapper. For deeper analysis of how asset correlations affect your wrapper decisions, the Correlation Calculator can help you avoid overlap. And for understanding the risk-adjusted returns of your portfolio structure, the Sharpe Ratio Explained: A UK Investor's Guide offers practical context. The best portfolio tracker for ISA and SIPP is the one that sees the wrapper, not just the wealth inside it.
Common Portfolio Tracker Mistakes — and How to Avoid Them
Picture the scene: You log into your tracker, see a healthy "gain" on the ISA withdrawal you made last month, and mentally congratulate yourself on a savvy trade. The problem? That withdrawal was entirely tax-free. Your tracker, which doesn't understand ISA wrappers, just added the withdrawal amount as a taxable gain, inflating your apparent performance and potentially leading you to believe you owe more tax than you do. This is Mistake #1 — using a generic tracker that ignores tax wrappers entirely. The consequence is a distorted view of your true net worth and, for a SIPP, a dangerous misreading of your available retirement income. The fix is simple: choose a portfolio tracker for ISA and SIPP that explicitly labels each account as tax-sheltered, so it treats all ISA withdrawals as zero-gain events.
Mistake #2 strikes when you receive tax relief on your SIPP contributions but fail to update your tracker's cost basis. Imagine you contributed £800 to your SIPP; the government adds £200 in basic-rate tax relief. If your tracker still shows your cost as £800 rather than the true £1,000 inside the pension, your Time-Weighted Return (TWR) calculations become meaningless. TWR is supposed to isolate your investment manager's skill by removing the effect of cash flows — but if the cost basis is wrong, the performance line is flawed. The consequence? You might think your investments are underperforming a benchmark when they're actually ahead, or vice versa. The fix: manually adjust the cost basis in your tracker or select one that automatically accounts for relief-at-source contributions. For investors drawing passive income, this also wrecks dividend tracking — a misstated cost basis throws off yield-on-cost metrics, making your SIPP income projections unreliable.
Mistake #3 is relying solely on a platform's own dashboard. The UK's DIY investing boom saw 2 million new accounts opened in 2025 across multiple providers. If you hold an ISA with one broker and a SIPP with another, neither dashboard shows your full picture. You might think you're underweight in bonds because your tracker only covers half your portfolio, then make a rebalancing trade that actually tilts you too far. The fix: consolidate all accounts into a single external portfolio tracker for ISA and SIPP that talks to both platforms.
Finally, Mistake #4: forgetting to track the 25% tax-free lump sum on your SIPP separately. Many trackers lump your entire pension value into one number. But that £100,000 SIPP isn't £100,000 in spending power — at least £25,000 of it is tax-free if accessed correctly. When planning withdrawals, treating the full amount as taxable can lead you to draw less than you could, costing you thousands in missed opportunities. Use a tracker that lets you create sub-accounts or manually adjust for the tax-free portion. And before you adjust your strategy, try our ROI Calculator to compare real withdrawal scenarios, or read Markowitz Portfolio Optimisation: Plain English for smarter allocation. For the sharpest analysis, our Free Tools section includes calculators that handle tax-wrapping natively — no hidden costs, just clear numbers.
Your Action Plan: Getting Started with the Right Portfolio Tracker Today
With the average DIY investor age dropping from 55 to 49 and the fastest growth in the 35-44 bracket, this plan is built for time-pressed professionals who need results without the admin drag. Here's your five-step route to a tracker that actually works for your ISA and SIPP.
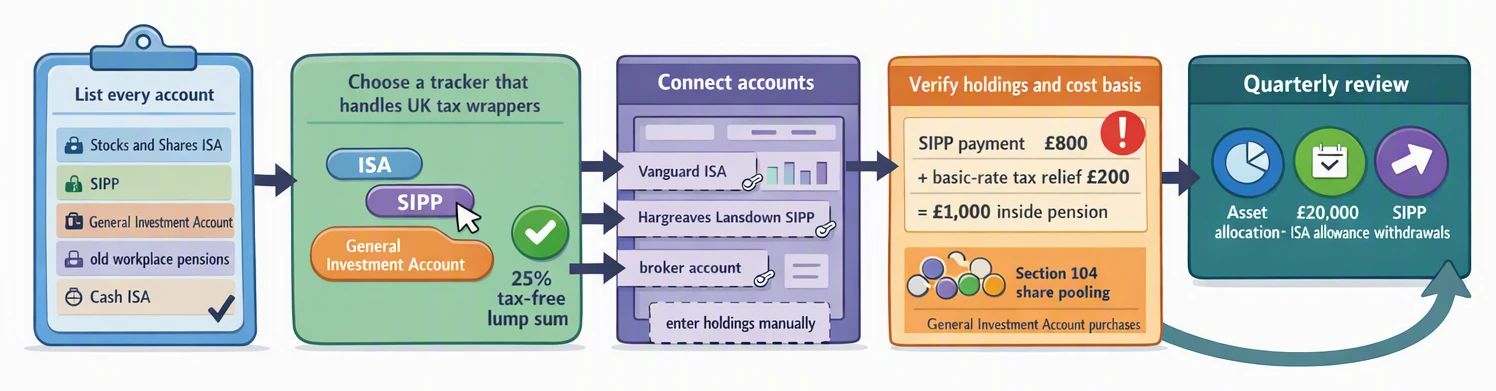
Step 1: List every single account you hold. Grab a notepad or a spreadsheet and write down every investment account you own — your Stocks and Shares ISA, your SIPP, any General Investment Account (GIA), and any old workplace pensions you've left dormant. Include your Cash ISA too, because a proper ISA portfolio tracker needs to distinguish between Cash ISA and Stocks and Shares ISA contributions for compliance purposes. Most people miss at least one account — the old company pension from three jobs ago, say, or that low-interest Cash ISA you opened for the switching bonus.
Step 2: Choose a tracker that explicitly handles UK tax wrappers. The perfect portfolio tracker for ISA and SIPP doesn't exist in a generic app — you need one built for UK rules. Read reviews, and crucially, test the free tier. Does it let you mark an account as "ISA" or "SIPP"? Does it understand that dividends inside an ISA are tax-free and shouldn't trigger a tax liability warning? If the platform doesn't discuss the 25% tax-free lump sum on your SIPP, move on. A tracker that misclassifies your income will cost you more in hidden complexity than any subscription fee.
Step 3: Connect your accounts. Most good trackers support Open Banking connections for major UK providers, which saves you manual entry. If your broker isn't supported — and some older SIPP providers aren't — you'll need to enter holdings manually. The data entry might take 30 minutes upfront, but it's a one-off effort that saves hours per quarter.
Step 4: Set up your holdings and verify each cost basis. This is where the real work happens, especially if you've transferred accounts between providers. Your tracker needs accurate purchase prices to calculate capital gains correctly for your GIA, and to distinguish between regular contributions and share transfers. If you have drawdown income from your SIPP — and UK savers withdrew £18.6 billion in taxable flexible pension payments in 2024/25, the highest total since pension freedoms began — your tracker must track those withdrawals separately.
Step 5: Review your portfolio at least quarterly. Check your asset allocation has drifted, verify you haven't breached your £20,000 ISA allowance across multiple providers, and confirm your SIPP drawdown income pattern is tax-efficient.
Once set up, you'll save literal hours each year and avoid costly errors like accidentally contributing to last year's ISA. Use our ROI Calculator to see the difference accurate tracking makes to your long-term returns, or read our guide to Sharpe Ratio Explained: A UK Investor's Guide to understand what your performance data actually means. The Investment Calculator can also help you model different contribution scenarios for your SIPP. Set aside one evening this week, follow these five steps, and you'll never look back.
Key Takeaways
- Choose a tracker that correctly distinguishes tax-free ISA dividends from taxable General Investment Account dividends, given the £500 dividend allowance for 2026/27, to avoid a misleading income picture.
- A SIPP tracker must account for the 25% tax-free lump sum (up to £268,275) to give an accurate projection of your retirement spending power, not just gross portfolio value.
- The best portfolio tracker for UK investors prioritises tax-wrapper accuracy over flashy charts, saving you from hidden complexity and planning errors that outweigh any subscription fee.
- Check that your tracker consolidates holdings across multiple ISAs and SIPPs from different brokers to properly assess your true asset allocation and net worth.
- Reject any tracker that misclassifies your SIPP’s tax-free cash as taxable income, as this silently inflates your projected tax liability and distorts your retirement strategy.
| Feature | Tracker That Gets It Right | Tracker That Gets It Wrong | Impact on Your Portfolio |
|---|---|---|---|
| ISA dividend classification | Correctly flags dividends as tax-free within the wrapper | Treats dividends as taxable income, inflating tax liability estimates | Misleading net return calculations |
| SIPP 25% tax-free lump sum | Accounts for the lump sum in withdrawal planning projections | Ignores the tax-free element, overestimating tax owed at retirement | Poor retirement income forecasts |
| Rebalancing alerts | Adjusts for tax wrapper rules before suggesting trades | Suggests trades that trigger unnecessary tax events | Hidden costs from unnecessary trades |
| Multi-account tracking | Aggregates ISA and SIPP while respecting each wrapper's rules | Blends all accounts into a single taxable view | Distorted portfolio performance picture |
Top Trackers Compared: Key Features for ISA and SIPP
| Tracker | ISA Dividend Handling | SIPP Tax-Free Lump Sum | UK Platform Support | Cost Model |
|---|---|---|---|---|
| Vanguard Personal Investor | Correctly flags dividends as tax-free in ISA | Does not model the 25% lump sum explicitly | Native Vanguard integration | Free with Vanguard account |
| Hargreaves Lansdown | Accurate tax wrapper recognition | Offers retirement withdrawal calculator | Broad UK broker support | Free with HL account |
| Morningstar | Manual override available for ISA dividends | No SIPP-specific lump sum feature | Limited direct UK broker links | Subscription from £20/month |
| Trustnet | Treats all dividends as equal, no wrapper flags | No SIPP lump sum data | Wide UK fund coverage | Free |
| Sharesight | Full ISA tax tracking, including dividends | Models the 25% tax-free lump sum | Supports 30+ UK brokers | Subscription from £15/month |
Sources
- Investment statistics in the UK: a comprehensive overview | Unbiased — Overview of UK investment trends and key statistics for retail investors.
- DIY Investor - The Do-It-Yourself Investing Blog — Reports that one in three Brits now invest as lower-cost platforms gain ground.
- boringmoneybusiness.co.uk — 2024 online investing report covering UK platforms and market developments.
- UK DIY investment balloons by more than £100bn in 2025 — Details the surge in UK DIY investment by over £100bn in 2025.
- UK ISA Statistics 2026: Key Facts & Figures — Key facts and figures on UK ISA statistics for 2026.
- finder.com — Statistics on Stocks and Shares ISA usage and trends in the UK.