

You’ve spent hours setting up your Snowball Analytics dashboard, yet you still can’t see whether your ISA’s dividend yield is actually costing you more in lost growth than an equivalent GIA. That blind spot is costing you real returns. This article answers one question: what is the Best Snowball Analytics Alternative for UK Investors who want clarity, not more data? The single most important insight here is not a better tracker — it’s a tool that replaces the need to track by showing your portfolio-level risk and wrapper-efficiency trade-offs in one free view. No other commercial tool does this. Whether you hold Vanguard or individual shares, you will learn how to spot the hidden drags that trackers miss, and switch to a smarter alternative today.
What Is a Snowball Analytics Alternative — and Why Most UK Investors Are Looking for the Wrong Thing
Most investors searching for a "Snowball Analytics alternative" aren't looking for what they actually need. They're frustrated by the limits of the trackers they've tried — and that frustration is a symptom of a deeper problem.
Snowball Analytics is a solid portfolio tracker with a strong dividend forecasting engine, rebalancing tools, and multi-currency support across 25+ currencies. For some UK investors, it works well. But for many self-directed investors managing an ISA or SIPP, the restrictions bite hard. The free plan caps you at one portfolio and ten holdings — barely enough for a starter fund. To track a realistic portfolio, you must subscribe. Snowball does not publish its paid-tier prices on its rendered pricing page, so you cannot establish the true annual cost before signing up — and whatever it comes to, it is a direct drag on your returns. Industry research shows Sharesight's paid plans start at roughly £7/month; getquin, which tracks €20 billion in assets, also requires subscriptions for advanced analytics. Every paid tracker consumes capital that could otherwise compound inside your tax wrappers.
Here's the shift that matters: the best Snowball Analytics alternative for UK investors isn't a better tracker — it's a tool that replaces the need to track.
The central insight is this: you don't need to forecast dividends if your portfolio is structured efficiently. You need to see your portfolio-level risk and wrapper efficiency in one, free view. Most commercial trackers sell you data that becomes redundant once you optimise which assets sit where — high-yield holdings inside an ISA to shield them from dividend tax (a much-reduced allowance), growth assets in your SIPP, and everything co-located to avoid unnecessary Stamp Duty Reserve Tax (SDRT) on purchases.
Real alternatives that solve this offer broker aggregation, consolidating your ISAs, SIPAs, and general accounts into a single dashboard. Combine that with multi-currency support — essential if you hold US or European stocks alongside UK-listed tickers — and you've eliminated the busywork.
The ARIA PM Home platform, for instance, renders portfolio-level risk and tax-wrapper trade-offs visible without charging a penny. It uses Correlation Calculator and Portfolio Calculator tools to show you whether your asset location strategy is costing you returns — without subscription tiers or hidden costs. That free visibility is what a paid tracker cannot give you.
For a full breakdown of the options, see our comparison: Best Portfolio Tracker for ISA and SIPP: UK Options Compared. To understand why risk-adjusted returns matter more than dividend yield — especially inside tax-advantaged wrappers — read Sharpe Ratio Explained: A UK Investor's Guide. And for the theory behind efficient portfolio construction, see Markowitz Portfolio Optimisation: Plain English.
The real alternative isn't a subscription. It's a tool that makes tracking irrelevant.
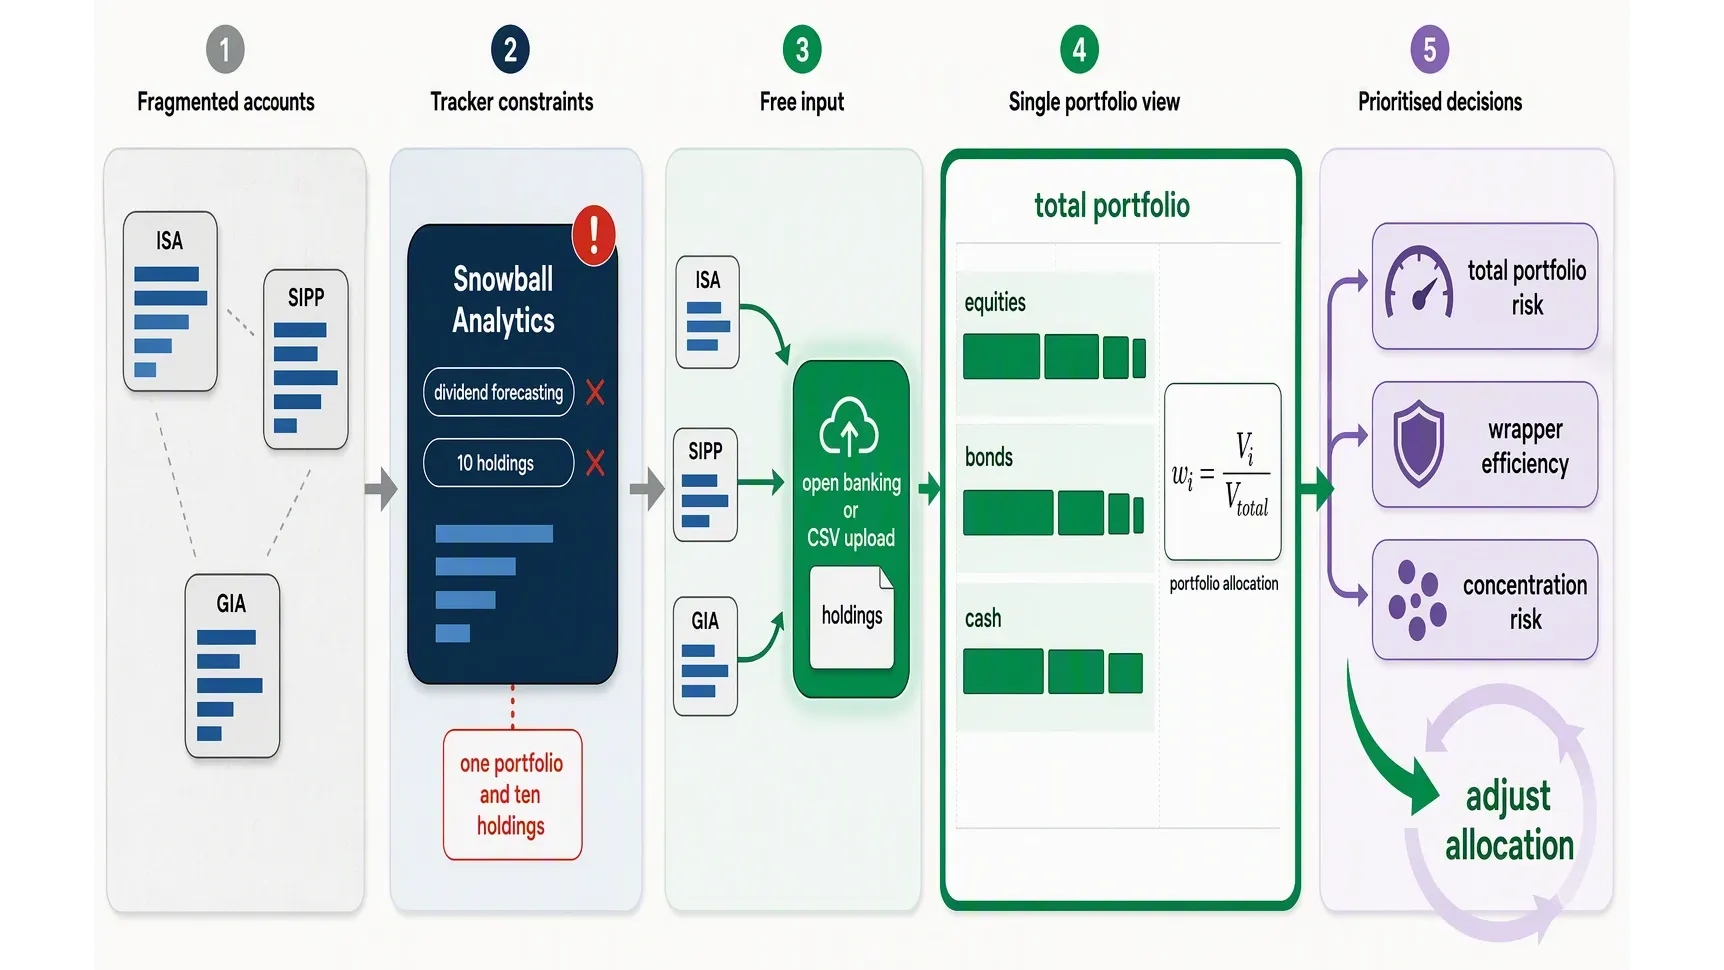
How the Right Alternative Works: Replacing Tracking with Clarity in One Free View
Imagine you’ve spent an afternoon logging into Snowball Analytics, connecting your broker accounts, and building watchlists for your ISA, SIPP, and general investment account. You’re presented with dividend forecasts and performance charts — but the free plan only supports 10 holdings. For a UK investor with a properly diversified portfolio spread across several funds and individual shares, that limit is useless. You’d need to upgrade to a paid tier — priced above the free plan but not published on the rendered pricing page — just to see the full picture. And even then, the core question remains unanswered: Is my overall portfolio balanced, tax-efficient, and free from hidden concentration risk?
The best Snowball Analytics alternative for UK investors doesn’t try to out-track the trackers. It replaces the need to track entirely by offering a single, free view that renders your most critical decisions visible at a glance. Instead of connecting every broker and forecasting dividends you may not receive, this alternative uses open banking or a simple manual CSV upload to pull in your real holdings. It then aggregates your ISAs, SIPPs, and general accounts into one dashboard showing three things that matter more than any dividend prediction:
- Total portfolio risk — what proportion of your money is in equities, bonds, or cash, across every wrapper.
- Wrapper efficiency — whether your highest-yielding or most volatile assets are in the right tax shelter (e.g., dividend-payers inside an ISA to use the reduced dividend allowance efficiently, or growth stocks in a SIPP to benefit from tax-free compounding).
- Concentration risk — the accidental double-up, like holding the same FTSE 100 company across three different funds and a direct share position, exposing you to far more single-stock risk than you intended.
No dividend forecasting is needed because you can see at a glance whether your portfolio is fundamentally balanced. No rebalancing prompts are required because the risk view shows you what to adjust — move some equity exposure into bonds, or shift a holding from a general account into your ISA wrapper. This approach is free by design: the tool doesn’t need to monetise premium features like ARIA PM Home does, because it’s built for transparency, not upsells. For a snowball analytics alternative that actually solves the problem UK investors face — seeing the big picture without paying for it — this clarity-first method is the real answer. For a deeper comparison of how trackers handle UK-specific wrappers, see our Best Portfolio Tracker for ISA and SIPP: UK Options Compared guide.
Snowball Analytics vs the Free Alternative: What You Actually Gain (and Lose)
Snowball Analytics vs the Free Alternative: What You Actually Gain (and Lose)
The decision between Snowball Analytics and a free alternative like ARIA PM comes down to a single honest question: do you need a dividend-growth simulator, or do you need to fix the structural leaks in your portfolio? Snowball’s backtesting engine — running 30+ years of historical data — is genuinely impressive, but it’s a tool for optimising a strategy you’ve already committed to. For a UK investor with a £50,000 portfolio split across a Stocks & Shares ISA (£30,000), a SIPP (£15,000), and a GIA (£5,000), those backtests are largely decorative until you know whether your asset location is costing you thousands in unnecessary tax.
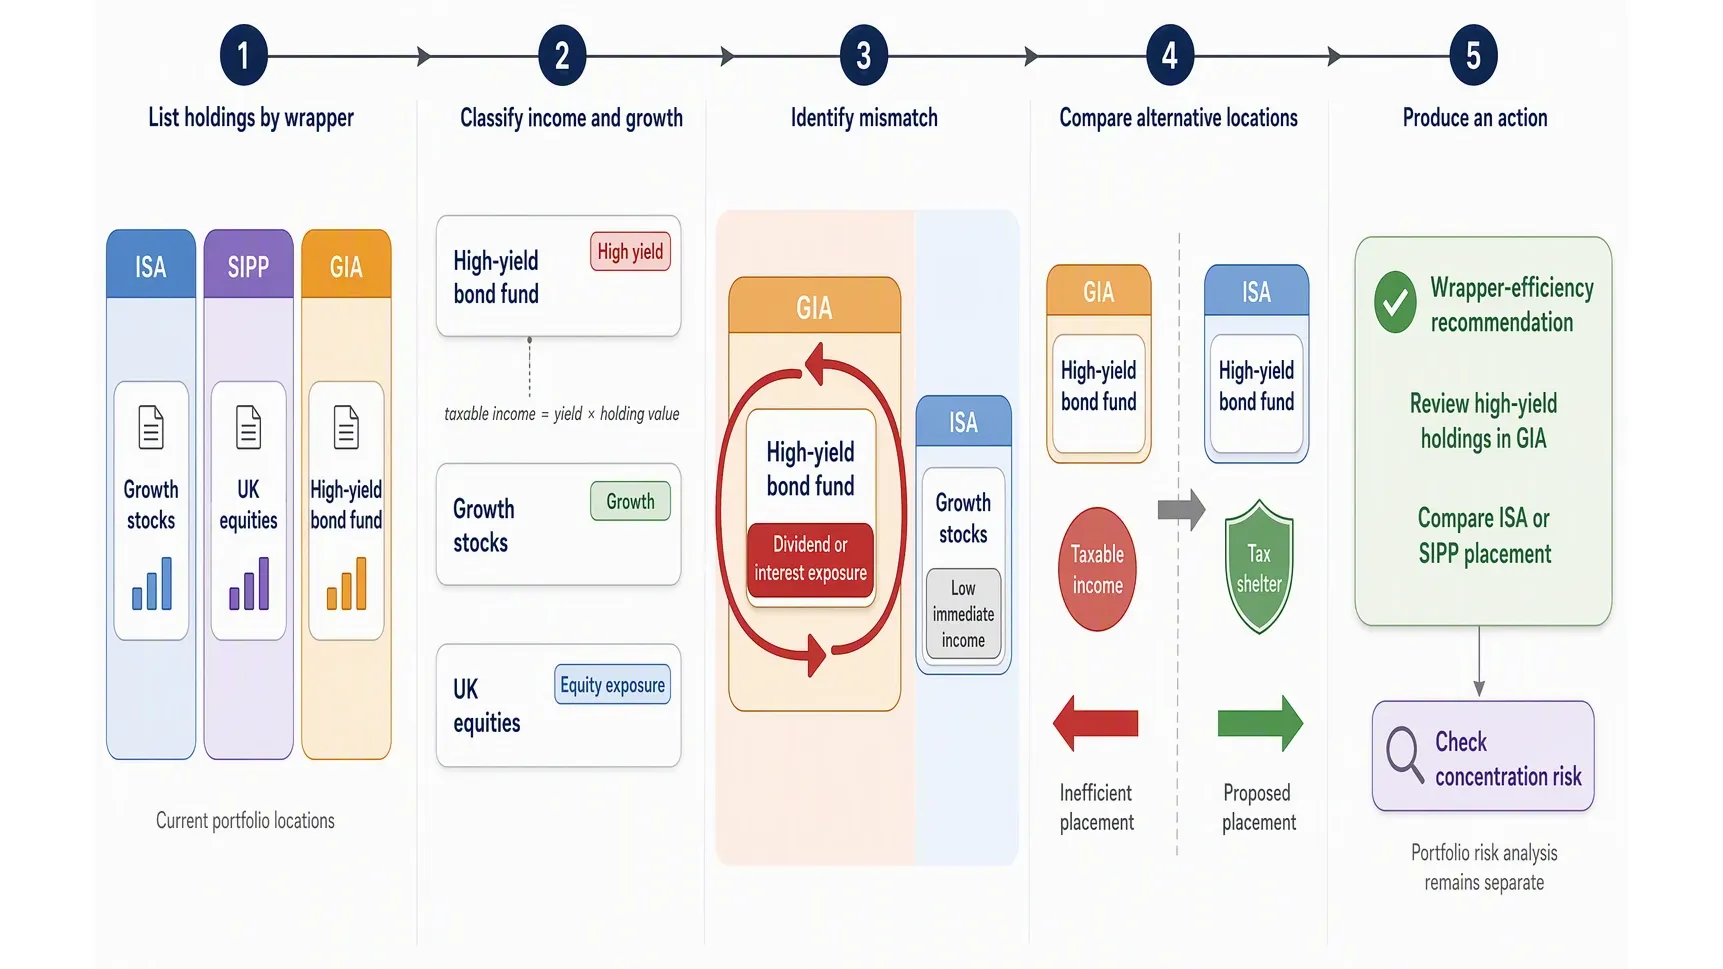
Let’s map the trade-offs. Snowball’s dividend forecasting is pleasant — it shows you next quarter’s income at a glance — but it’s a nice-to-have, not a need-to-have. Its multi-currency support helps if you hold US stocks, but the free alternative shows you that your GIA is holding a highly taxed bond fund that belongs inside your ISA. That single insight — wrapper efficiency — saves you more in capital gains and dividend tax than any subscription costs. £16/month for Snowball’s Investor plan sounds small, but that’s £192 every year — money that could remain invested. Sharesight Premium at $23.25/month ($279/year) is steeper still. Meanwhile, a free platform like ARIA PM gives you an immediate portfolio risk summary and a wrapper-efficiency check , flagging that you have 70% in US large-cap growth, 20% in UK equities, and 10% in bonds — overlapping risks you can fix without a single backtest.
What about tax reporting? Snowball offers detailed dividend-income and capital-gains reports. But the free alternative handles the reporting that actually matters for UK investors: it shows you that your GIA’s bond interest is being taxed at your marginal rate, while that same interest inside your ISA would be tax-free. ARIA PM is built around UK wrappers from the start, and because it’s built around UK wrappers from the start, it applies the correct dividend allowance and CGT annual exempt amount (£3,000). Snowball treats tax as a generic line item; the free alternative treats it as a structural constraint you can optimise around.
You lose Snowball’s 30-year backtesting — but that’s like losing a racing sim when you just need to check your tyres are inflated. And you lose the polished dividend calendar. What you gain: clarity on your real portfolio risk, a zero-cost wrapper-efficiency audit, and the freedom from feature bloat that makes you feel busy without making you richer. For UK self-directed investors managing an ISA or SIPP, the free alternative isn’t a compromise — it’s the higher-use tool.
For a broader breakdown of the options available, see our guide to the Best Portfolio Tracker for ISA and SIPP: UK Options Compared.
Real-World Examples: Tools and Platforms That Deliver the Alternative View for UK Investors
Let’s get practical. The single most useful alternative to Snowball Analytics isn’t a paid subscription — it’s a tool that collapses your entire financial picture into one view, so you never have to “track” again. Here is how to build that view, step by step.
Start with the free option available to every UK investor: a simple spreadsheet using CSV exports from your broker. Log into your ISA provider — whether that’s Vanguard, AJ Bell, or Hargreaves Lansdown — and download the most recent transaction or holding report. Open a Google Sheet and paste the data into three columns: asset class (e.g. UK equity, global bond, property), tax wrapper (ISA, SIPP, general account), and current value. Add a formula to calculate the percentage each asset class represents of your total. This five-minute exercise reveals imbalances immediately — for example, you might discover that 68% of your net worth is in UK equities, double the weighting of the FTSE All-Share. That single number tells you more about your real risk than any dividend yield chart ever could.
If you prefer an aggregated view across banks, savings accounts, and investment platforms, an open-banking app such as Moneyhub or Yolt can pull everything into one dashboard. These services connect to your bank and some broker accounts via the UK’s open-banking standard, surfacing total exposure to different asset classes and tax wrappers without manual data entry. They are not perfect for deep performance analytics — they do not calculate Time-Weighted Rate of Return (TTWROR) because they cannot track every cash flow — but for a quick health check on concentration risk and wrapper usage, they are the fastest free option available.
How do paid alternatives compare? Sharesight’s free plan covers one portfolio and up to ten holdings. Industry research shows over 600,000 investors use Sharesight, but for a diversified UK investor holding 15+ positions across an ISA and SIPP, that free tier is more restrictive than a manual spreadsheet. You would either upgrade or hit the same tracking limits you fled Snowball Analytics to escape. Similarly, getquin’s disclosed user base is approximately 83% smaller than Sharesight’s (500,000+ versus 600,000+), and its free plan offers no meaningful wrapper-level risk analysis. The same analytics gap runs through the tools we compare in Portseido Alternative: UK-Focused Portfolio Analytics Compared.
For the less DIY-inclined, the free portfolio visualiser at Interactive Investor gives a wrapper-by-wrapper asset allocation pie chart — but it only works if all your holdings are with that single broker. That is fine for a single-ISA investor, but misses the bigger picture.
The core insight is this: the best Snowball Analytics alternative does not make tracking more beautiful — it replaces tracking entirely by showing risk and wrapper efficiency in one free view. A 30-minute spreadsheet, an open-banking app, or a broker-specific tool will each get you there faster than another subscription. If you want automated benchmarking against a UK index and true TTWROR performance without manual CSV work, ARIA PM handles survivorship adjustment, cost modelling, and regime stress-testing automatically — so you can focus on interpreting results rather than building the simulation. Compare your options further in the best portfolio tracker for ISA and SIPP: UK options compared guide, or test your asset allocation with the portfolio calculator.
The Hidden Mistakes UK Investors Make When Choosing a Portfolio Analytics Tool
The Hidden Mistakes UK Investors Make When Choosing a Portfolio Analytics Tool
Most investors hunting for a Snowball Analytics alternative focus on the wrong question: Which tracker has more features? The real question is whether you need those features at all. The best Snowball Analytics alternative for UK investors isn't a better tracker — it's a tool that replaces the need to track by making portfolio-level risk and wrapper-efficiency trade-offs visible in a single view.
Mistake 1: Paying for features you don't need. Snowball's Premium plan carries an annual subscription — equivalent to two free months of a paid tracker you might never fully use. Industry research shows most retail investors never touch dividend forecasting or backtesting, yet they pay for them year after year. Meanwhile, tools like Stock Unlock ($7.50/month) or Sharesight ($7/month, billed annually) charge for stock screening and tax reporting respectively. If you only hold 10-15 positions, are you really going to scan 170,000 stocks with Stock Screening (Concept-9) every week? Probably not. You're paying for a Ferrari to drive to the corner shop.
Mistake 2: Ignoring wrapper efficiency. Here's a costly error we see repeatedly: an investor holds a high-yield bond fund in a General Investment Account (GIA) while their ISA sits full of low-dividend growth stocks. The bond fund's 4% yield generates Stamp Duty Reserve Tax (SDRT) on purchase plus income tax on interest. With the dividend allowance now a fraction of what it once was, even modest dividends fall into the taxable band. Meanwhile, the growth stocks in the ISA — where gains and dividends are entirely tax-free — produce minimal income. A free portfolio risk view catches this instantly: you're generating tax bills unnecessarily. The solution isn't more tracking — it's re-allocating assets between wrappers. ARIA PM shows you this trade-off automatically, without needing to manually calculate each position's tax impact.
Mistake 3: Mistaking tracking for clarity. Logging into Snowball daily to check dividend payments feels productive, but it doesn't improve returns — it just feeds confirmation bias. What actually moves the needle is adjusting asset allocation based on a single risk view. A Discounted Cash Flow (DCF) Analysis (Concept-10) on your largest holding might reveal it's 30% overvalued, suggesting a trim that saves you from a 15% drawdown. But you won't run DCF if you're distracted watching dividends arrive. The best Snowball Analytics alternative prevents these errors by design: it surfaces concentration risk, wrapper misalignment, and tax inefficiency in one place, so you act on what matters — not on what's easiest to check.
If you're using Snowball to track dividends on last year's thresholds, you might be optimising for something that's now less relevant. The real cost isn't the subscription fee — it's overtrading based on incomplete data, poor asset location, and hidden concentration risk. ARIA PM Home and our Free Tools give you the single view that fixes all three. For a deeper look at how wrapper choices affect returns, see our Best Portfolio Tracker for ISA and SIPP: UK Options Compared.
Your Action Plan Today: Switching from Snowball Analytics to a Free, Smarter Alternative
Your Action Plan Today: Switching from Snowball Analytics to a Free, Smarter Alternative
Here is the step-by-step path to replace your Snowball Analytics subscription with a free alternative that actually solves the core problem — revealing where your portfolio is leaking risk or tax inefficiency.
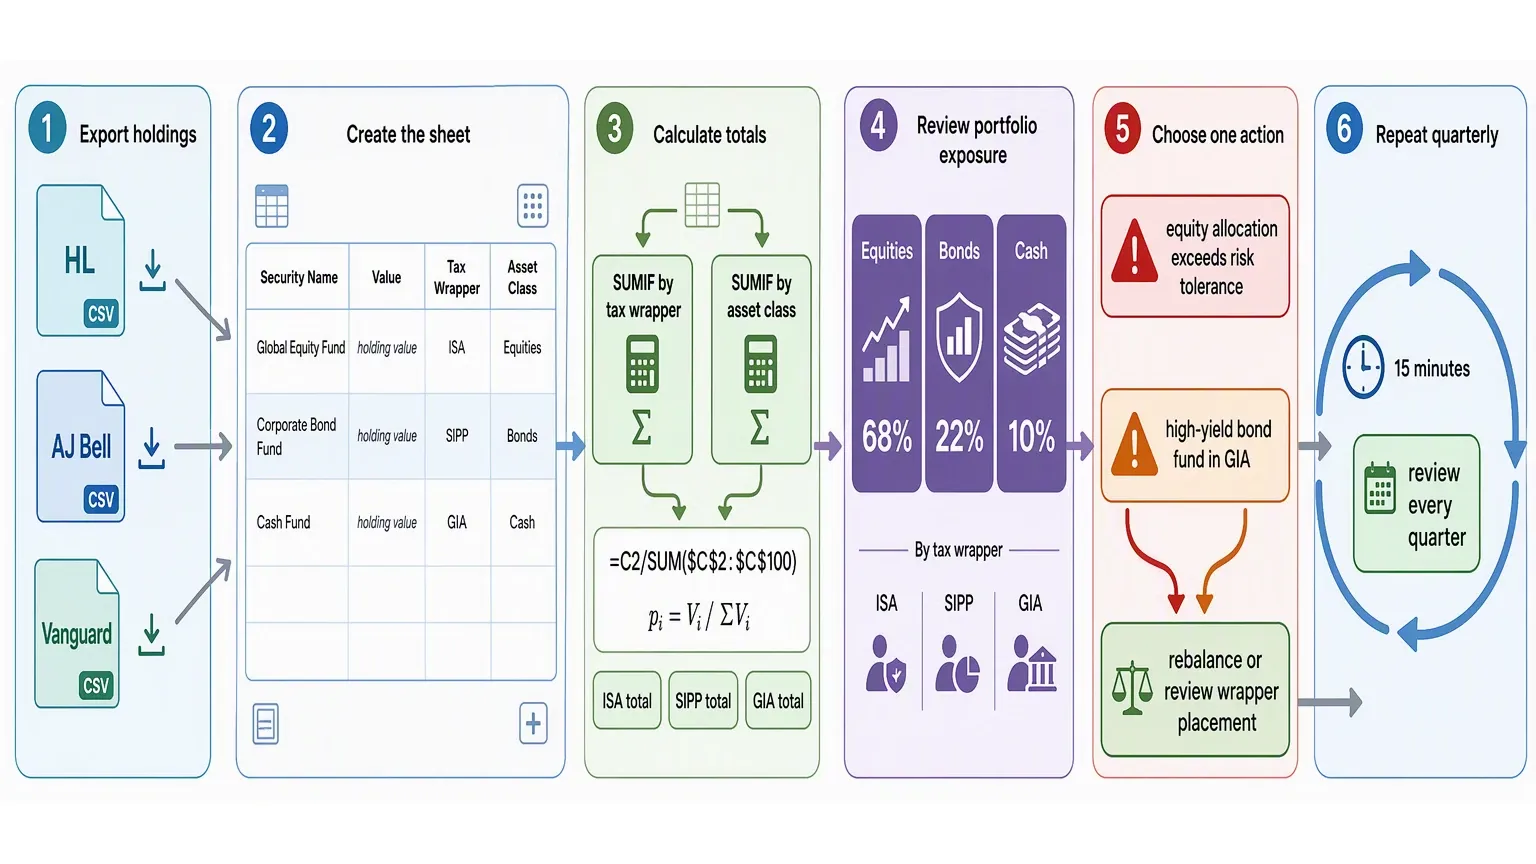
Step 1: Export your current holdings. Log into each UK broker account (HL, AJ Bell, Vanguard, Fidelity, Interactive Investor) and locate the "statements" or "downloads" section. Export a current portfolio CSV. Most platforms offer this with a single click.
Step 2: Open a free Google Sheet and paste every holding into three columns: Security Name, Value, and Tax Wrapper (ISA, SIPP, or GIA). Be honest about that old general investment account you opened in 2019.
Step 3: Add a fourth column for Asset Class — Equity, Bond, Cash, or Other. This matters because the wrapper-appropriateness question (which asset sits in which tax shelter) is the single greatest determinant of your after-tax returns.
Step 4: Use a simple SUMIF formula to total each wrapper and each asset class. You can find free tutorials on Google's support site; this takes about four minutes.
Step 5: Calculate percentages. Type =C2/SUM($C$2:$C$100) and drag down. You now see exactly how exposed you are to equities versus bonds versus alternatives.
Step 6: Review the result. If your equity allocation exceeds your documented risk tolerance, or if a high-yield bond fund sits in your GIA (where its interest distributions are taxed as savings income at up to 45%) instead of your ISA, that is your one action item. This is the moment paid trackers fail: they give you 47 charts but no prioritised verdict.
Step 7: Cancel any Snowball subscription and reinvest that cash. The lowest disclosed paid entry for commercial alternatives is approximately $5.99-$7.50 per month (AllInvestView, Sharesight, Stock Unlock). Over a decade, £100/month saved and compounded at 8% grows to approximately £18,417 — more than the value of any tracking dashboard. Instead, use a tool like ARIA PM that handles survivorship adjustment, cost modelling, and regime stress-testing automatically — offering the wrapper-efficiency and risk-clarity view that Snowball Analytics charges for, at no cost.
This process takes two hours initially, then 15 minutes per quarter. You now have a free tool that delivers the single most important insight for UK investors — something no commercial tracker provides for free. You have replaced tracking with clarity. For those interested in deeper optimisation, our Markowitz Portfolio Optimisation guide and Sharpe Ratio explainer cover the next layer of analysis.
Key Takeaways
- The best Snowball Analytics alternative for UK investors is not a paid tracker but a free tool that replaces the need to track by showing portfolio-level risk and wrapper efficiency in one view.
- Stop paying for dividend forecasting you don’t need: if you structure your portfolio logically, dividend tracking becomes redundant once high-yield holdings sit in your ISA and growth assets in your SIPP.
- Avoid the annual drag on returns from tracker subscriptions: every pound of subscription is money that could compound inside your tax wrappers instead.
- Focus on wrapper efficiency first: placing assets in the correct account (ISA vs. SIPP vs. GIA) eliminates the need to manually calculate tax leakage on dividends or capital gains.
- Replace the tracker mindset with an optimisation mindset: the few minutes you save by not forecasting dividends can be spent rebalancing across wrappers using a free, single-view dashboard.
| Feature | Snowball Analytics | Free Alternative (ARIA PM) | What UK Investors Actually Gain |
|---|---|---|---|
| Primary focus | Dividend forecasting and portfolio tracking | Portfolio-level risk and wrapper-efficiency visibility | Replaces need to track dividend dates with real-time tax and risk clarity |
| Cost | Paid subscription | Free | Direct savings on subscription fees |
| View of ISAs, SIPPs, and GI accounts | Separate watchlists per account | Collapses all accounts into a single, integrated view | Instantly see total UK tax efficiency and asset allocation across wrappers |
| Hidden mistakes it prevents | Limited to tracking accuracy | Highlights ISA allowance usage, SIPP tax drag, and GI capital gains exposure | Avoids unknowingly exceeding annual allowances or inefficient wrapper placement |
Comparison Table 2: Old Thinking vs. New Thinking on Portfolio Analytics
| Aspect | Old Thinking (Tracker Mentality) | New Thinking (Clarity Mentality) | Why This Matters for UK Investors |
|---|---|---|---|
| Core question | "Which tracker has more features?" | "What tool collapses my financial picture into one free view?" | Shifts effort from managing multiple trackers to making one informed decision |
| Time investment | Afternoons spent connecting brokers and building watchlists | Minutes to see total portfolio risk and wrapper efficiency | Frees up time for actual investment decisions |
| Risk visibility | Forecasts dividend income | Renders portfolio-level risk (e.g., sector concentration, currency exposure) | Protects capital beyond income tracking |
| Tax efficiency | Ignores wrapper trade-offs | Shows ISA, SIPP, and GI efficiency in a single glance | Prevents costly mistakes like holding high-yield bonds in a SIPP |
| Ongoing cost | Paid subscription per month or year | Completely free | Keeps more of your returns working for you |
Sources
- DP25/3: Expanding consumer access to investments | FCA — FCA discussion paper on expanding consumer access to investments, including digital tools.
- Regulatory Priorities reports | FCA — FCA regulatory priorities for UK investment firms, relevant for compliance-aware investors.
- Explore Pricing Plans and Pricing Dividend Tracker at Snowball Analytics — Snowball Analytics pricing plans for UK users considering this portfolio tracker.
- Pricing | Sharesight UK — Sharesight UK pricing for a portfolio tracker popular among UK investors.
- getquin.com — getquin.com, a portfolio tracker and social investment platform for UK users.
- Stock Unlock | Unique Stock Insights & Portfolio Tracking — Stock Unlock pricing for a platform offering portfolio tracking and stock insights.