
Sarah, a UK investor, sees her portfolio tracker show a healthy gain. But after accounting for stamp duty and dividend taxes, her actual return is significantly lower. This gap isn't just annoying; it means her asset allocation and performance assessments are fundamentally flawed, potentially costing her in unnecessary taxes and suboptimal investment choices.
This article answers a critical question: What UK-focused portfolio analytics solution truly accounts for local complexities like Stamp Duty Reserve Tax and dividend tax? We explore why standard tools fail UK investors and how genuine Portseido alternatives rebuild their core mathematics to handle these unique frictions. You'll discover how UK-optimised analytics works, compare top alternatives, avoid common mistakes, and learn how to switch effectively. No technical expertise needed.
What is a Portseido Alternative? (And Why UK Investors Should Care)
Ever tried using a generic portfolio analytics tool as a UK investor, only to find your performance numbers feel slightly… off? You're not alone. Many investors wrestling with platforms like Portseido — a globally popular portfolio analytics tool — discover they're optimising for a frictionless world that doesn't reflect British reality. Portseido excels at broad market analysis, but UK portfolios face unique hurdles that demand specialised solutions. This isn't about minor tweaks; it's about fundamental differences in how investments behave here.
So, what exactly is a Portseido alternative? It's a UK-focused portfolio analytics tool rebuilt from the ground up to handle Britain's distinctive market mechanics. Generic tools often stumble over two critical UK quirks: stamp duty reserve tax (SDRT) and dividend tax. SDRT adds 0.5% to every UK share purchase — a cost that directly erodes returns. Imagine buying £10,000 of FTSE 100 shares: you immediately pay £50 in stamp duty, meaning you start £50 underwater. Dividend tax, meanwhile, complicates income calculations, as it changes the net you keep on payouts. These aren't just "local details"; they warp the maths behind portfolio optimisation.
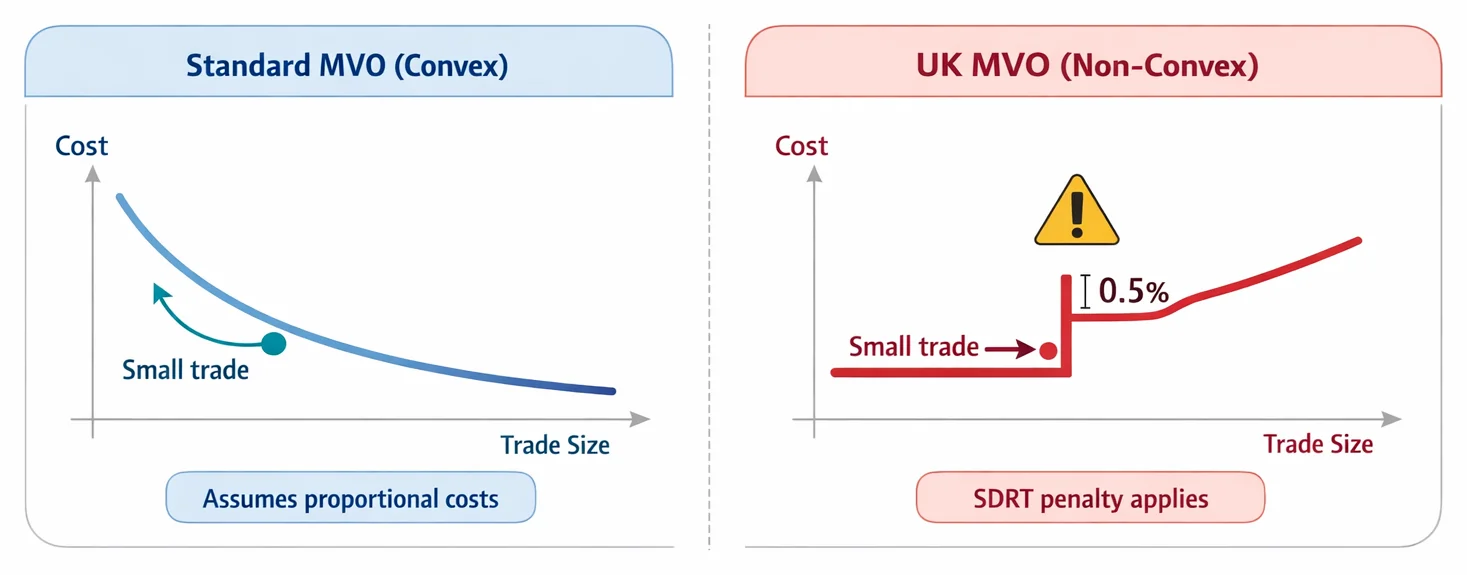
Why does this matter mathematically? Standard models like mean-variance optimisation (explained simply in our Markowitz Portfolio Optimisation: Plain English guide) assume smooth, predictable relationships between risk and return. But UK taxes add real costs these models ignore. For instance, that 0.5% stamp duty applies to every purchase, yet the model never sees it. A tool not accounting for this might suggest frequent small trades, unaware each one incurs the duty. The result? "Optimal" portfolios that are inefficient or even loss-making in practice.
True UK alternatives go beyond slapping on a London data feed. They embed these frictions into their calculations. For bonds, they adjust yield-to-maturity calculations — which estimate total returns including coupons and price changes — for UK gilt taxation. For options traders, they provide real-time Greeks (metrics like delta or gamma that measure sensitivity to market moves) calibrated to LSE-traded instruments. This precision ensures tools like AllInvestView — which offers a free plan plus paid analytics tiers, with tax reporting for the UK among other countries — can surface more UK-relevant insights than a one-size-fits-all global setup.
Cost efficiency amplifies the appeal. Why pay for global features that misfire on UK assets? Alternatives prioritise local relevance, whether modelling ISA allowances or accurately projecting compounding returns (try our Compound Interest Calculator to see fee impacts). They also integrate tools like our Correlation Calculator to assess UK asset relationships, or our Sharpe Ratio Explained: A UK Investor's Guide to adjust risk assessments for domestic volatility. For hands-on testing, our Portfolio Calculator lets you simulate UK tax drags instantly.
In short: a Portseido alternative isn't a clone. It's a purpose-built solution for investors navigating Britain's fiscal landscape — turning market quirks from hidden liabilities into optimised outcomes.
Why UK Tax Rules Break Standard Portfolio Trackers
Imagine planning a road trip using a map that ignores toll roads. You'd expect a direct route, only to hit unexpected fees that blow your budget and delay your arrival. That's precisely what happens when UK investors use standard portfolio trackers designed for US markets. The UK's unique tax rules — particularly Stamp Duty Reserve Tax (SDRT) and dividend tax — act like hidden tolls, distorting performance calculations and breaking core investment maths.
Start with stamp duty. When you buy UK shares, you pay 0.5% SDRT upfront. If you invest £10,000 in FTSE 100 stocks, your actual cost basis isn’t £10,000 — it’s £10,050. Generic tools often record the £10,000 trade value, ignoring the £50 fee. This understates your true investment cost, inflating apparent returns. Over time, as trades compound, the error snowballs. For instance, a 7% annual return on the true £10,050 cost basis grows to about £19,770 over 10 years — but a tracker that starts from £10,000 measures the same end value against a smaller base, overstating the gain by the missing stamp duty plus its compounded growth. Our investment calculator reveals how such small cost differences impact long-term wealth.
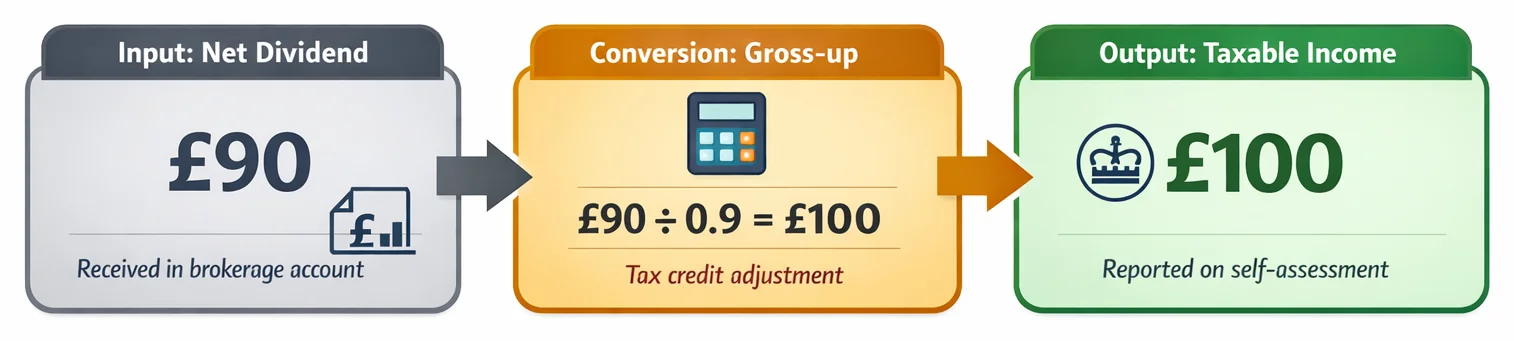
Then there’s dividend tax. Until April 2016, UK investors received a 10% notional tax credit on dividends — but that system was abolished entirely. There is no longer any credit to reclaim or gross up. Since then, dividends are covered by a tax-free dividend allowance (£500 for 2024/25) and taxed above it at 8.75% (basic rate), 33.75% (higher rate), or 39.35% (additional rate). US tools often treat dividends as simple income; UK investors need the allowance and the correct rate applied. Miss this, and your tracker misrepresents taxable income — potentially triggering compliance headaches or incorrect tax bills.
These frictions matter most for rebalancing. Standard mean-variance models (like the classic Markowitz Portfolio Optimisation) often assume trading is effectively free. But SDRT adds 0.5% to every UK share purchase, so a model that ignores it will happily recommend frequent rebalancing that quietly loses money after tax. The result? Trades that look optimal on paper but underperform in reality — rebalancing so often that the stamp duty outweighs the benefit.
US-focused platforms ignore these quirks. They’re built for markets without purchase taxes and with simpler dividend rules. When applied to UK portfolios, they generate misleading Sharpe ratios (overstating risk-adjusted returns) and inaccurate correlations. For example, a tracker might label two UK stocks as "low correlation" assets, unaware that stamp duty makes switching between them costly — a hidden friction our correlation calculator would need to factor in.
Modern UK alternatives tackle this by rebuilding their maths engines. Some even incorporate AI-powered portfolio analysis to simulate stamp duty impacts during backtests or model dividend tax scenarios. Others unify traditional and cryptocurrency tracking, adapting tax logic for each asset class. Without these adjustments, investors navigate blind — their "optimised" portfolio skewed by unaccounted tolls on the financial roadmap.
How UK-Optimised Portfolio Analytics Actually Works
For UK investors, portfolio analytics tools must go beyond basic tracking. They need to rebuild core calculations to handle unique market frictions that distort standard models. Here’s how UK-optimised tools tackle this in four practical steps:
Automatic Stamp Duty Calculation on Purchases: When you buy UK shares, you pay a 0.5% stamp duty reserve tax (SDRT) on the transaction value. Generic tools ignore this, inflating your apparent returns. UK-focused analytics fixes this: when you log a trade, it auto-adds stamp duty to your cost basis. For example, buying £10,000 of shares incurs £50 stamp duty — making your true entry cost £10,050. This adjustment is critical for accurate performance measurement and capital gains calculations later. Tools like Snowball Analytics (a close Portseido alternative) handle this smoothly during data import.
Dividend Tracking Against the Allowance and Rates: Since April 2016 there is no dividend tax credit and no gross-up — you report the actual dividends you receive. What matters is the tax-free dividend allowance (£500 for 2024/25) and the dividend tax rates above it (8.75%/33.75%/39.35%). UK tools track your running dividend total against the allowance and flag when you cross it, so your self-assessment figures match what HMRC expects. This avoids both under-reporting and paying tax you don’t owe.
Tax-Efficient Performance Reporting: Standard tools show pre-tax returns, but UK investors need to see real-world outcomes. Optimised analytics provides metrics like "after-stamp-duty returns" using simple adjustments: Adjusted return = (current value − initial investment − stamp duty) ÷ initial investment. For instance, a £10,000 investment growing to £11,000 with £50 stamp duty yields a 9.5% return (£950 gain / £10,000), not 10%. This realism extends to risk metrics — our Sharpe Ratio Explained guide details why including costs matters for volatility analysis.
Capital Gains Tax Forecasts: By tracking your adjusted cost basis (including stamp duty), these tools model CGT liabilities. They factor in your annual CGT exempt amount (£3,000 for 2024/25) and the rates on share gains (18% for basic-rate, 24% for higher-rate taxpayers). If you partially exit a position, they use HMRC’s "share pooling" rules to calculate average acquisition costs. This helps plan disposals tax-efficiently — try our Portfolio Calculator to simulate scenarios.
Beyond these steps, UK tools automate HMRC-compatible tax summaries and capital gains reports. Snowball Analytics exemplifies this approach, generating dividend summaries and CGT worksheets with one click. For deeper strategy insights, our Markowitz Portfolio Optimisation guide explains how building trading costs into the optimisation stops generic models from recommending trades that lose money after tax. Ultimately, this precision transforms abstract maths into actionable UK-specific insights — letting you focus on decisions, not data wrangling.
Top Portseido Alternatives Compared: UK Features & Pricing
For UK investors, portfolio analytics tools must transcend generic global solutions. As our central thesis argues, British market complexities — like Stamp Duty Reserve Tax and dividend tax — add real trading costs that standard optimisation models ignore. Below, we compare top alternatives engineered for these frictions, grouped by investor profiles:
For Dividend-Focused Investors
- Snowball Analytics: Specialises in dividend tracking and forecasting, ideal for income portfolios. It visualises payment schedules, yield trends, and dividend growth, though its tax handling is less automated than competitors.
- Sharesight: Excels in automatic dividend and CGT reports, with specific handling of UK dividend tax and LSE-listed stocks. Its reports auto-calculate taxable income and capital gains, streamlining HMRC compliance. (Advanced tax reports require a paid tier.)
For Tax-Optimisation Seekers
- AllInvestView: A budget-friendly option with a free plan and paid tiers. It provides tax reporting for multiple countries (including the UK) and models scenarios for CGT allowances, dividend taxes, and ISA wrappers — useful breadth for the price.
For Open-Source Advocates
- Ghostfolio: Open-source, so you can self-host it for free, with a low-cost hosted plan if you’d rather not run it yourself. While UK tax logic requires manual configuration, its flexibility suits those building bespoke dashboards.
For Global/Multi-Asset Investors
- Mezzi: Connects to a broad range of global financial institutions and includes a unified net-worth dashboard, with risk and drawdown stress-testing — useful for viewing UK assets against global volatility.
Pricing & UK Specialisation Breakdown
| Tool | Key UK Strength | Pricing model |
|---|---|---|
| Portseido | Advanced backtesting | Free trial; paid plans |
| AllInvestView | Multi-country tax reporting | Free plan; paid tiers |
| Ghostfolio | Open-source customisation | Free to self-host; paid cloud |
| Sharesight | Automated CGT/dividend reports | Free tier; paid plans |
| Snowball Analytics | Dividend forecasting | Freemium |
| Mezzi | Global net-worth aggregation + risk | Paid subscription |
Why Generic Tools Fall Short
Standard mean-variance models (like those in our Markowitz optimisation guide) ignore UK frictions. For example:
- Stamp duty (0.5% on UK shares) distorts rebalancing maths.
- Dividend tax alters net returns, misrepresenting true performance in tools lacking LSE-specific logic. As shown in our Sharpe ratio analysis, these gaps skew risk-adjusted metrics.
Key Considerations
- Cost vs. Complexity: AllInvestView’s low-cost paid tier suits cost-sensitive investors, while Sharesight’s automation justifies higher pricing for active traders.
- DIY Flexibility: Ghostfolio’s open-source model allows custom tax coding but demands technical skill.
- Accuracy Trade-offs: Mezzi’s drawdown stress-testing helps model UK volatility, but verify its stamp duty adjustments.
For long-term projections, always cross-check tool outputs with our compound interest calculator — a £10,000 investment at 7% annual growth for 20 years becomes £38,697 before adjusting for UK taxes. The right tool bridges this gap between raw maths and real-world returns.
Critical Mistakes UK Investors Make With Portfolio Trackers
UK investors often undermine their portfolio analysis by overlooking how uniquely British market mechanics disrupt conventional financial models. As our central argument states: UK-focused analytics isn't just about local data feeds — it demands proper handling of frictions like Stamp Duty Reserve Tax (SDRT) and dividend tax. These fixed per-trade and per-income costs distort standard mean-variance optimisation, a concept we unpack in our plain-English guide. Here are four costly errors and how to avoid them:
Using US Tools That Ignore Stamp Duty Many default to popular US trackers, unaware they exclude SDRT from cost-basis calculations. This distorts returns: a £10,000 UK equity purchase with 0.5% SDRT (£50) starts with a real cost basis of £10,050. If the tool logs £10,000, it overstates gains by 0.5% from day one. Solution: Verify tools automatically embed SDRT in cost basis.
Manual Tax Adjustments Inviting Errors Dividend tax (the UK’s 8.75% basic-rate dividend tax, rising to 33.75% and 39.35%) requires precise handling. Manually adjusting these often leads to miscalculated yield or taxable income — especially when reinvested. Such errors cascade into flawed Sharpe ratios and risk assessments, skewing portfolio decisions. Solution: Use UK-native tools automating dividend tax treatments. For DIY checks, our free Sharpe ratio calculator helps validate outputs.
Overpaying for Irrelevant Features Investors frequently subscribe to premium global platforms charging for capabilities they’ll never use — like crypto or private equity tracking for ISA-exclusive portfolios. For example, Kubera is a premium tool aimed at high-net-worth users and may over-serve simple UK equity holders. Solution: Match tools to actual holdings. Basic share portfolios can use leaner options like Snowball Analytics, or our free portfolio calculator for quick checks.
Ignoring Currency Conversion Costs Holding global assets? Every FX conversion erodes returns. A £10,000 USD purchase with a 1% fee leaves only £9,900 invested. Over 10 years at 7% growth, that £100 would have grown to roughly £197 — so the real cost is the fee plus its forgone compounding. Yet most tools omit these fees, inflating performance. Solution: Prioritise tools with real-time multi-currency support that deduct FX fees automatically — like Snowball Analytics, which handles conversions dynamically.
These mistakes compound silently. A tool neglecting SDRT and FX fees can materially overstate a portfolio’s long-run return — enough to mislead asset allocation or retirement planning. Always stress-test tools against UK-specific friction points. For quick validations, our suite of free analytics tools—including an ROI calculator and correlation analyser—offers a practical safety net.
Your Action Plan: Switching to a UK-Optimised Tracker
Switching to a UK-focused analytics tool isn’t just a convenience — it’s a practical necessity. As we’ve established, British market quirks like Stamp Duty Reserve Tax and dividend tax distort the figures that standard, US-oriented portfolio models produce. To avoid skewed returns or tax errors, follow these steps:
Audit your current tool’s UK gaps Start by checking if your existing platform accurately handles UK-specific costs. Can it auto-calculate stamp duty (typically 0.5% on share purchases) or adjust for dividend tax? Import a recent UK equity trade — like buying £5,000 of Lloyds shares — and verify if fees and taxes match real brokerage statements. If results seem off, it’s likely using generic assumptions that ignore British frictions, breaking core models like Markowitz portfolio optimisation.
Test 2-3 alternatives via free trials Prioritise tools built for UK markets:
- Sharesight: Excels at dividend tracking (yield, growth, income visualisation) and supports ISAs/SIPPs.
- AllInvestView: Strong on tax reporting and multi-currency handling.
- Snowball Analytics: reliable for fund analysis and capital gains calculations. Avoid tools relying solely on generic frameworks — open-source platforms offer customisation but demand coding skills for UK tax logic. Use trials to compare interfaces; aim for <30-minute setup.
- Import a sample UK-heavy portfolio Create a test portfolio with 5-10 holdings reflecting typical UK investments:
- UK equities (e.g., Shell, Unilever)
- Investment trusts (e.g., Scottish Mortgage)
- Funds (e.g., Vanguard FTSE All-Share)
- Assets held in an ISA or SIPP Check if the tool auto-identifies UK dividends and applies the dividend allowance correctly. For advanced needs, tools like ARIA PM handle survivorship adjustment, cost modelling, and regime stress-testing automatically — letting you focus on results, not spreadsheet builds.
Validate tax reports against HMRC rules Run a dividend report for the tax year. Does it correctly apply the £500 dividend allowance (2024/25) and the 8.75%/33.75%/39.35% dividend tax rates above it? Cross-check with HMRC’s guidance or your self-assessment history. For example, £10,000 of dividends outside an ISA leaves £9,500 taxable after the allowance — about £831 of tax for a basic-rate investor. Mismatches here risk penalties.
Choose based on cost and features Match the tool to your portfolio size and complexity:
- Under £100,000? Start with Sharesight’s free tier.
- Over £250,000 or complex holdings? Compare paid plans (e.g., AllInvestView’s tax-lot handling). Use our free portfolio calculator to model fees’ long-term impact: £10,000 growing at 7%/year for 20 years becomes £38,697 — but a 0.4% annual tool fee (a net 6.6%/year) reduces it to about £35,900, roughly £2,800 less.
UK Tracker Checklist Must-haves for any alternative: Automated dividend tax (allowance and rate) adjustments ISA/SIPP account support Stamp duty calculation on purchases Capital gains reports aligned with HMRC rules Dividend-focused tracking for yield/growth analysis
Fix this gap before the next tax season. Delaying risks misreporting capital gains or overlooking £100s in unused dividend and CGT allowances — errors that compound over time. For deeper dives into performance metrics, see our guide to the Sharpe ratio for UK investors or explore our suite of free tools for quick validations.
![]()
Key Takeaways
- UK investors need portfolio analytics tools that account for British costs like stamp duty and dividend tax, rather than assuming a frictionless US-style market.
- Stamp Duty Reserve Tax (SDRT) imposes a 0.5% cost per UK share purchase, making small, frequent rebalancing suggested by generic tools potentially loss-making.
- Dividend tax (an allowance plus 8.75%/33.75%/39.35% rates) significantly alters net income and tax calculations, demanding specific handling within portfolio performance analytics.
- Generic portfolio optimisers unaware of UK tax frictions can recommend "optimal" strategies that are inefficient or even unprofitable in the British market context.
| Feature | Standard Analytics Tools | UK-Optimised Analytics Tools |
|---|---|---|
| Stamp Duty Handling | Ignores or estimates trade fees | Applies the flat 0.5% SDRT to share purchases |
| Dividend Tax | Ignores the £500 allowance and dividend tax | Applies the allowance and 8.75%/33.75% rates automatically |
| Optimisation Method | Cost-blind mean-variance models | Cost-aware optimisation that nets out trading taxes |
| Cost Basis Calculation | Simple FIFO without SDRT impact | Adjusts acquisition costs for stamp duty paid |
| Performance Reporting | Pre-tax or generic tax assumptions | Post-tax returns with UK CGT/income tax logic |
UK Portfolio Tracker Selection Criteria
| Critical Requirement | Why It Matters | Key Solution Features |
|---|---|---|
| Stamp Duty Integration | SDRT adds a flat 0.5% to every share purchase | Builds the 0.5% into cost basis and net-return maths |
| Dividend Tax Mapping | Mishandled dividend tax distorts net yield | Applies the dividend allowance and correct rates to income |
| Cost-Aware Optimisation | Cost-blind rebalancers suggest loss-making trades | Optimisation that accounts for per-trade trading taxes |
| UK Tax Wrapper Support | ISA/SIPP rules alter tax outcomes | Custom rules for tax-free vs. taxable account handling |
| HMRC-Validated Reporting | Manual tax adjustments cause filing errors | Capital gains reports matching HMRC methodologies |
Sources
- FCA InvestSmart: Understanding price graphs — FCA guidance on why past performance shouldn't be the primary factor for investment decisions.
- FCA InvestSmart: Risk and returns — FCA's breakdown of investment risks and diversification principles for UK investors.
- Investor.gov: Portfolio Diversification — SEC educational resource on diversification strategies and portfolio construction basics.
- Morningstar UK Investing Classroom: Steps to a suitable portfolio — Morningstar's educational classroom on portfolio analysis techniques and performance measurement.
- Hargreaves Lansdown: How to build a portfolio — Practical guide to portfolio construction and analysis from a major UK platform.
- MoneyHelper: Investing — a beginner's guide — UK government-backed advice on portfolio fundamentals and risk assessment.


