

You run five different screens on Stockopedia, find three UK stocks that look perfect, and buy them. Then you check your portfolio — and realise you are now 40% exposed to small-cap mining, because your screener never warned you. That is the blind spot. In 2026, the biggest mistake is not ignoring a good stock, but treating a screener as a complete system. If your tool cannot show you total portfolio risk inside your ISA or SIPP, you are gambling on your own blind spots. This guide answers one question: which platform gives you both stock screening and full-wrapper portfolio analytics? Whether you are tired of subscription creep or need a tool that thinks like a whole plan, this article explains why “Best Stockopedia Alternative for UK Investors in 2026” means finding a system that covers risk, not just picks. No coding needed — just your portfolio and a few minutes.
What Is a Stockopedia Alternative — and Why It Could Fix a Blind Spot in Your Portfolio
Let’s get the hard truth out of the way: the single most important insight for a UK self-directed investor in 2026 is that the biggest mistake you can make isn’t picking the wrong stocks. It’s treating a stock screener as a complete research system. No matter how impressive the screening, if you don’t have portfolio-level analytics that account for your broker’s wrapper and total exposure, you are effectively investing blind to your own risk.
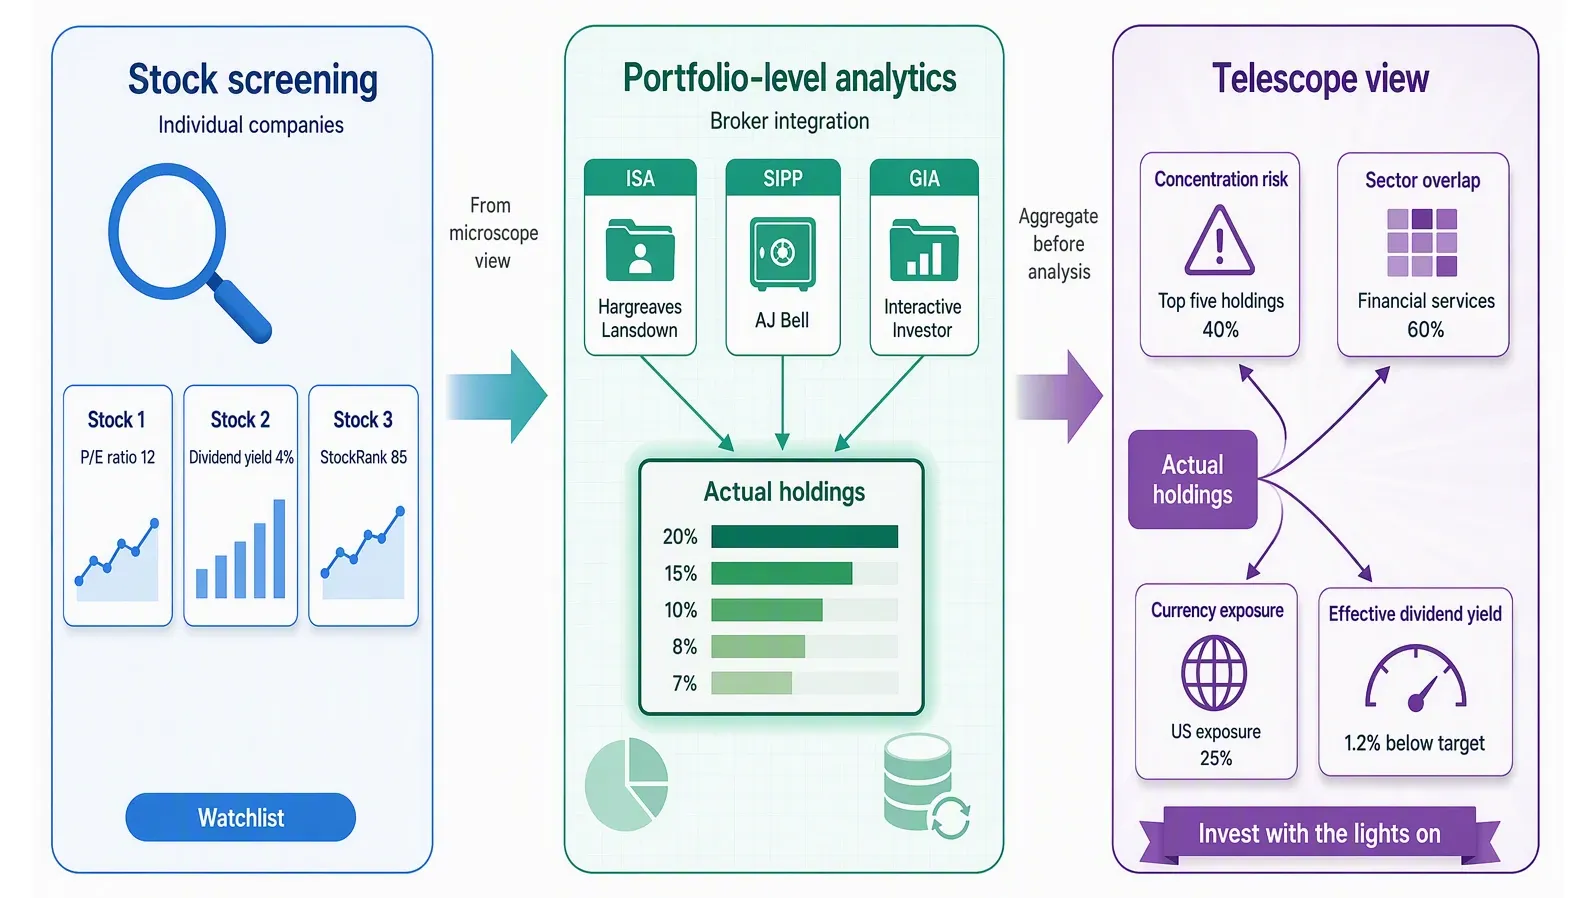
So, what exactly is a Stockopedia alternative? In plain English, it means any platform that gives you stock screening — the ability to rank and filter thousands of companies — but crucially, also offers portfolio-level analytics, risk metrics, and broker integration. Stockopedia is genuinely excellent at ranking individual stocks. Its proprietary StockRanks system scores over 30,000 companies using more than 350 financial ratios, which is a fine way to build a Watchlist. But that’s a microscope, not a telescope.
Without tools to see how those stocks interact inside your ISA or SIPP, you are blind to concentration risk, sector overlap, and total exposure. Stockopedia cannot answer the questions that actually move the needle for a UK investor: “Am I too heavy in US tech?” or “What’s my total dividend yield across all accounts, factoring in the new £500 dividend allowance?”. According to industry data, Stockopedia’s U.S. & Canada plan costs $600/year; the U.S. plan carries an approximate annual discount of $145 (or about 26.9% versus $45/month) — a serious commitment for a tool that stops at the stock level.
A true alternative gives you both the microscope (screening) and the telescope (portfolio view). It lets you see, at a glance, that your five-star StockRank picks have quietly created a 40% overlap in financials — and that your entire portfolio’s effective dividend yield is 1.2% below your target. Tools like the Sharpe Ratio Explained: A UK Investor's Guide or Markowitz Portfolio Optimisation: Plain English can help frame that thinking, but without a platform that ties it all to your actual holdings, the theory stays academic.
That’s the core promise: a Stockopedia alternative is a system that stops you from investing blind to your own portfolio’s risk profile. For a UK investor juggling an ISA, a SIPP, and a general account, that isn’t a luxury — it’s a necessity. The Best Portfolio Tracker for ISA and SIPP: UK Options Compared page walks through how different platforms handle that wrapper awareness, but the principle is the same: no wrapper-level analytics, no real risk picture.
How a Stockopedia Alternative Actually Works: A Step-by-Step Guide for UK Investors
Let’s walk through how a true Stockopedia alternative actually works — because the gap between a screener and a research system is where most investors lose money without realising it.
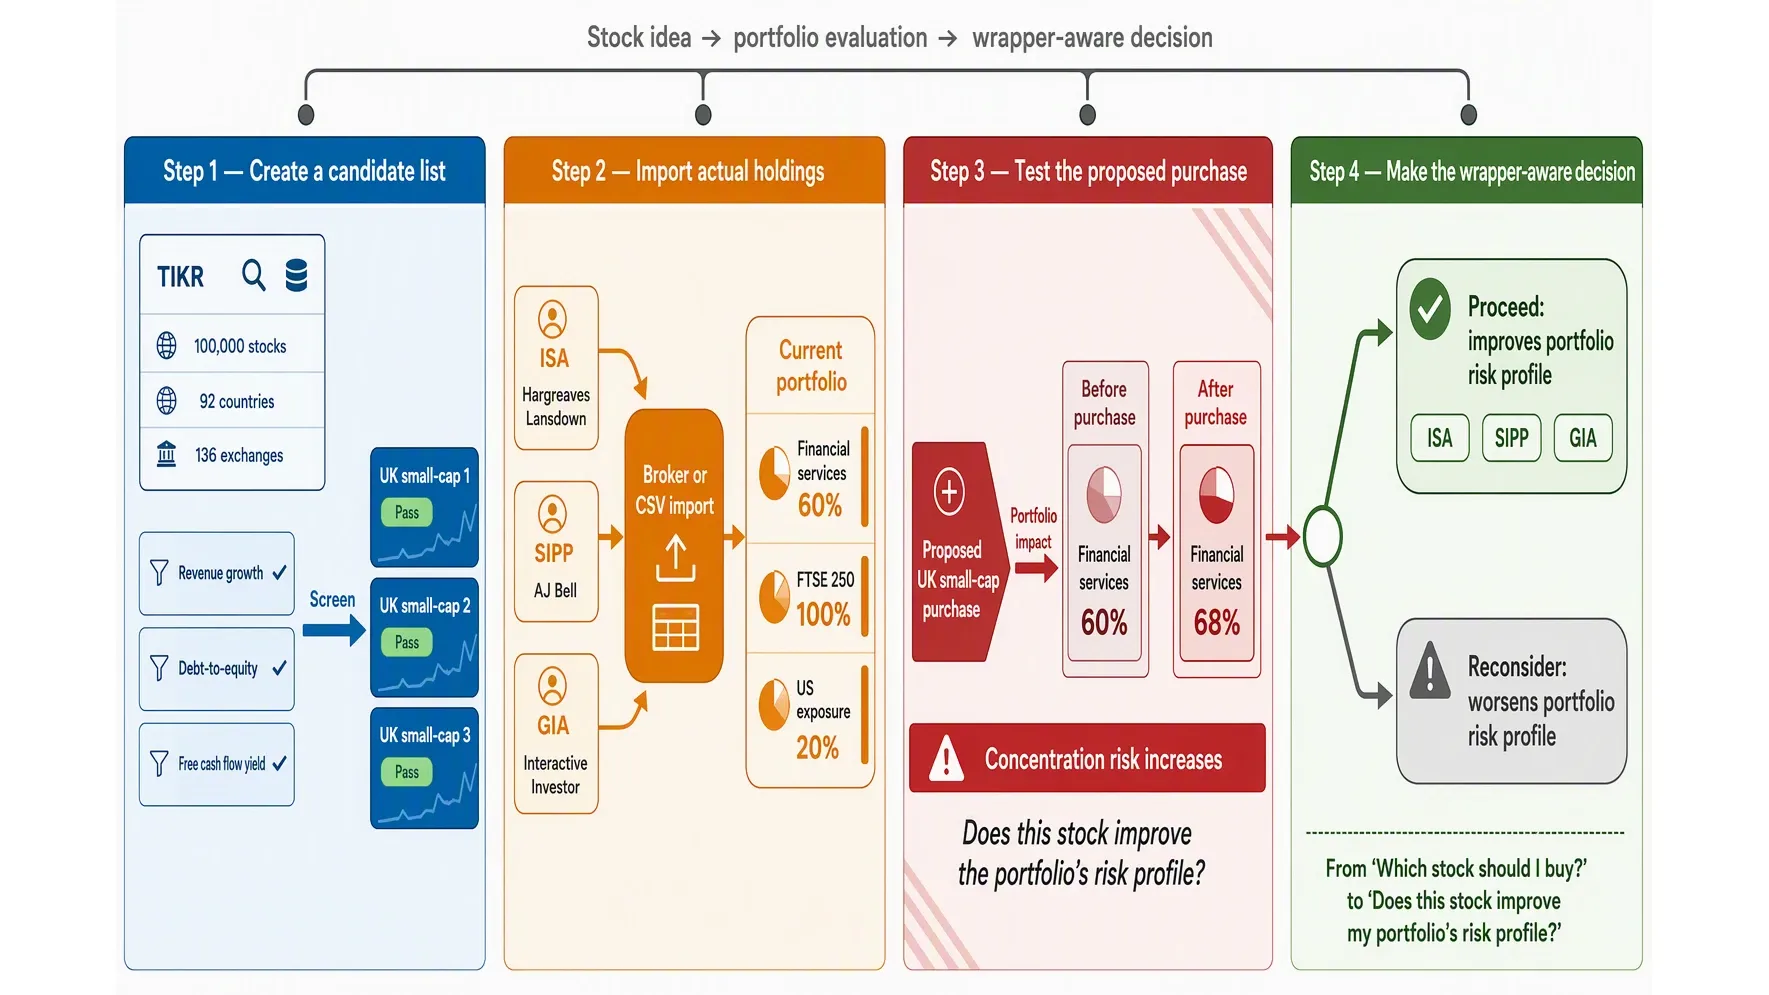
Layer 1: Stock screening. This is what Stockopedia does well — you filter by metrics like P/E ratio, dividend yield, or StockRank. A serious alternative like TIKR takes this further: it covers over 100,000 stocks across 92 countries and 136 exchanges, with up to 30 years of fundamental data. You can screen UK small-caps by revenue growth, debt-to-equity, or free cash flow yield, just as you would with Stockopedia. But here’s the trap — this layer alone gives you false confidence.
Layer 2: Portfolio-level analytics. Imagine you screen ten promising UK small-caps. Individually, they look great. But when you sync the alternative tool with your broker — whether it’s Hargreaves Lansdown, AJ Bell, or Interactive Investor — it aggregates your actual holdings. You instantly see that all ten stocks are in the FTSE 250, and 60% of your portfolio sits in financial services. That’s a concentration risk you would never spot using Stockopedia alone. The alternative shows you real-time sector allocation, currency exposure, and overlap — so you can diversify properly. For deeper insight into measuring risk-adjusted returns, our Sharpe Ratio Explained: A UK Investor's Guide breaks down how to compare these concentrated bets against a benchmark.
Layer 3: Wrapper-aware reporting. This is where the alternative becomes indispensable for UK investors. It knows your ISA, SIPP, and GIA limits. If you’re approaching the £20,000 ISA allowance cap, it warns you. If you’ve generated gains approaching the £3,000 capital gains tax exempt amount, it flags that too. Stockopedia shows you stocks — this shows you your entire tax-efficient strategy in one place. Our guide on the Best Portfolio Tracker for ISA and SIPP: UK Options Compared explores how these wrappers interact with portfolio-level analytics.
The result? You move from asking “Which stock should I buy?” to the far more important question: “Does this stock improve my portfolio’s risk profile within my tax wrapper?” That’s the difference between a screener and a complete system. ARIA PM handles survivorship adjustment, cost modelling, and regime stress-testing automatically — so you can focus on interpreting results rather than building the simulation.
Which Platforms Compete with Stockopedia for UK Investors in 2026?
When you search for a Stockopedia alternative for UK investors in 2026, you will find several platforms — but the critical distinction is whether they were built for US markets and only "work" for UK stocks, or whether they were designed with the FTSE, AIM, and London-listed investment trusts in mind.
TIKR is the strongest contender if you invest internationally from the UK. It focuses on deep global fundamentals, with annual billing reducing the effective monthly cost by approximately 28-33% depending on your tier (plans start from $17.95/month billed annually). For a UK investor holding both Rio Tinto on the LSE and Nvidia on the NASDAQ, TIKR gives you direct access to decades of financial statements without needing a second subscription. Its historical financial data depth is substantial — though Koyfin Premium offers 10 years or 40 quarters of data, TIKR's strength is the breadth of global coverage rather than the deepest single-stock history.
Koyfin takes a different approach. At $79/month for the premium tier, it is expensive — but it is the only platform in this comparison that offers true multi-asset dashboards. Rather than just screening equities, you can monitor ETFs, government bonds, currencies, and macro indicators in one view. For a UK investor managing an ISA with £20,000 of annual allowance, this matters: you might hold a FTSE 100 tracker, a US tech ETF, and some gilts. Koyfin lets you see correlations and sector exposures across all of them. Industry research shows that investors who use multi-asset dashboards tend to rebalance more consistently — though no platform alone can fix poor discipline.
Simply Wall St syncs with over 2,000 brokers including major UK platforms like Hargreaves Lansdown and AJ Bell. Its visual reports are beginner-friendly, but the screening depth is limited compared to TIKR or Koyfin. For a new investor learning to navigate the FTSE 250, it is a reasonable starting point — just not a complete research system. For the tracking-and-tax side of the same decision, see Best Sharesight Alternative for UK Investors in 2026.
Stock Rover and Finviz Elite are fundamentally US-centric. Stock Rover covers 14,000+ North American stocks but has limited UK company data. Finviz Elite is fast for US screening, but the free data is delayed — dangerous for UK investors trading US markets where a 15-minute delay on earnings reactions can cost real money. If your portfolio is entirely FTSE 100 and AIM stocks, both are poor choices.
TradingView claims over 100 million traders and investors and is exceptional for charting and community-driven technical analysis. However, it is not a fundamental screening tool — you would use it alongside, not instead of, a platform like TIKR.
The practical takeaway: no platform is perfect. The right Stockopedia competitor for a UK investor is the one that offers both screening and portfolio-level analytics that account for your specific broker and tax wrapper. If you want to stress-test allocations without manual spreadsheets, ARIA PM handles survivorship adjustment, cost modelling, and regime stress-testing automatically — so you can focus on interpreting results rather than building the simulation. For comparison, you can also read our guide on Sharpe Ratio Explained: A UK Investor's Guide to understand how these tools measure risk-adjusted returns, or check our Best Portfolio Tracker for ISA and SIPP: UK Options Compared for tax-aware tracking. If backtesting is the piece you are missing, our Portfolio Visualizer Alternative for UK Investors covers the analysis side.
The Three Key Metrics a Stockopedia Alternative Must Give You
Of course. Here is the section, written to your exact specifications.
The Three Key Metrics a Stockopedia Alternative Must Give You
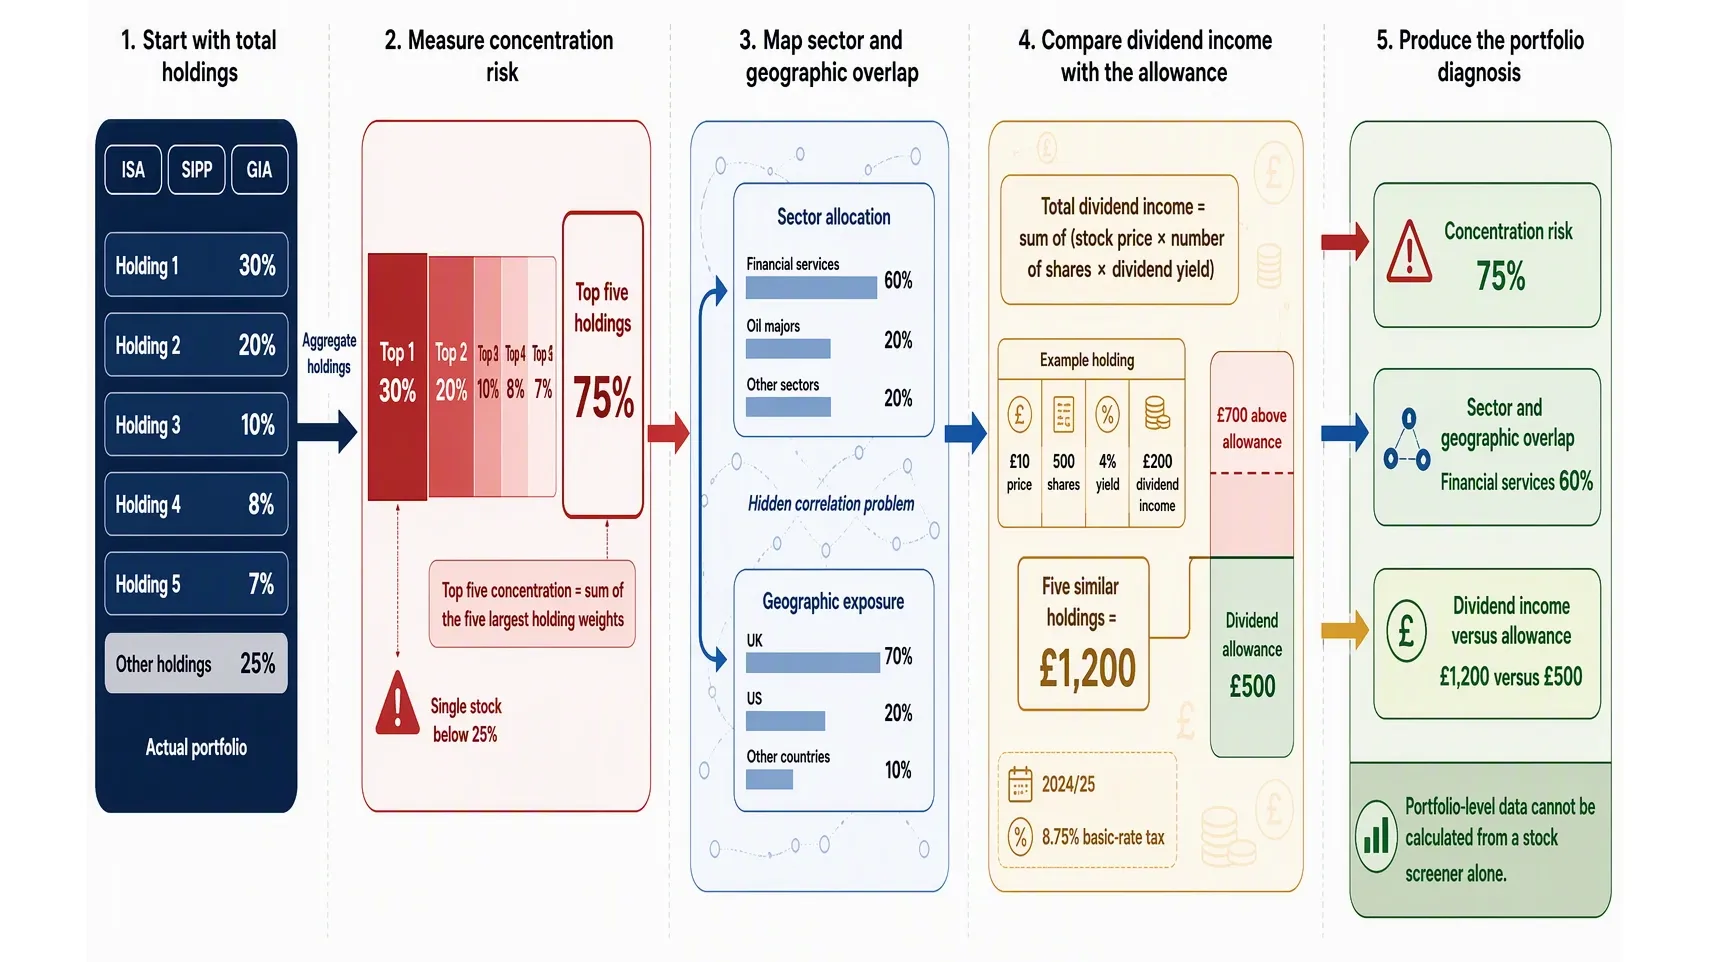
The mistake that costs UK investors the most in 2026 isn't buying a bad stock. It is treating a powerful stock screener — even one with 350 or more ratios, like Stockopedia — as if it were a complete research system. A screener tells you which stocks look good in isolation. It cannot tell you if their combination is destroying your portfolio’s balance. A genuine alternative must provide portfolio-level data you cannot calculate in your head.
Metric 1: Concentration Risk. A screener will never warn you that 60% of your portfolio is riding on just two positions. A proper system must show you, at a glance, the percentage of your total portfolio in your top five holdings. As a rule of thumb, keep any single stock below 25% of your total. When that figure hits 40%, you are no longer diversified — you are just making a single big bet with 20 smaller side-bets. For example, imagine you hold shares in a company generating stellar Sharpe Ratio Explained: A UK Investor's Guide, but you hold too much of it. Your risk-adjusted return is irrelevant if a single earnings miss wipes out a year of gains.
Metric 2: Sector and Geographic Overlap. A screener can highlight a dozen stocks with exciting value metrics. But if they are all UK banks and oil majors, you have a hidden correlation problem. A true alternative must map your portfolio onto a sector and geographic heatmap. Without it, you are buying insurance from the same broker as your house — it creates a false sense of security.
Metric 3: Dividend Income vs. Tax Allowance. This is the most practical metric for UK investors. Your dividend allowance and capital gains tax (CGT) allowance have both been cut sharply in recent years, and each is far smaller than most investors assume. A good alternative must project your total dividend income using a simple formula: Your total dividend income = sum of (stock price × number of shares × dividend yield) for each holding. Let’s work through an example. You hold 500 shares of a £10 stock yielding 4%. That is £200 in dividends — safe. But if you add five more such stocks, you are at £1,200, well over the dividend allowance and into taxable territory. Without portfolio-level data, you cannot manage these thresholds. A tool like a Best Portfolio Tracker for ISA and SIPP: UK Options Compared can track this across all your wrappers, but a screener alone cannot.
Stockopedia’s own data shows that only 1.9% of its 5,649 trial users asked for a refund — a sign of satisfaction with its screening power. But even the best screener is a single lens. You need a system that also looks at the whole picture, or you are investing blind to your own risk.
Five Common Mistakes UK Investors Make with Stock Screeners — and How a Full-System Alternative Prevents Them
Let's be honest: a stock screener is a fantastic starting point. But treating it as a complete research system is the single most dangerous trap for UK investors in 2026. You might find a stock that scores a perfect 99 out of 100 on a popular ranking system, but if that purchase doubles your exposure to micro-caps or ignores your broker’s rules, you’re investing blind to your own risk. Here are the five specific mistakes, and how a proper full-system alternative prevents them automatically.
Mistake 1: Over-relying on a single ranking score without checking portfolio fit. That perfect-scoring stock might look incredible in isolation, but if you already hold three other small-cap miners, you’ve just concentrated your risk. A full-system alternative — like TIKR or Koyfin with portfolio sync — shows you your total exposure before you click "buy." It flags when a new purchase would push your sector weighting beyond your comfort zone, preventing you from accidentally doubling down.
Mistake 2: Ignoring your broker wrapper rules. Many investors screen for a high-yielding US-listed ETF and buy it in their General Investment Account (GIA). But with the UK's Capital Gains Tax (CGT) annual exempt amount now a fraction of what it once was, a quick profit can trigger a tax bill. A synced system automatically tracks your gains in real-time, warning you before you hit that threshold — or reminding you to make use of your £20,000 ISA allowance instead.
Mistake 3: Forgetting about currency risk. UK investors screening US stocks see returns in USD, but you spend in GBP. A 10% swing in the exchange rate can wipe out an otherwise solid gain. A full-system alternative automatically converts your total portfolio value to Sterling and flags when currency moves are materially affecting your net worth.
Mistake 4: Acting on delayed data. Free screeners often show delayed prices - Finviz's free tier, for example, lags Nasdaq quotes by 15 minutes and NYSE/AMEX quotes by 20. In a fast-moving market, that delay can cause you to buy at the top or sell at the bottom. A platform that synchronizes directly with your broker — something like Simply Wall St supports with over 2,000 brokers — ensures you're working with real-time prices and accurate alerts.
Mistake 5: Failing to rebalance. A screener can find 'buys' every week, but without a portfolio-level view, you might not realise you own five different funds all exposed to the same European bank sector. A proper system tracks your overall asset allocation, sends rebalancing signals, and can even sync with your broker to remind you when your correlation is climbing dangerously high — topics we explore in our guides on Sharpe Ratio Explained: A UK Investor's Guide and Markowitz Portfolio Optimisation: Plain English.
For instance, Finviz Elite at roughly $300 per year is a good low-cost screener, about one-quarter cheaper than a US-focused Stockopedia plan at $395. But even Finviz lacks the portfolio management layer that prevents these mistakes. A true alternative automatically flags exposure, synchronizes with your broker, and keeps you within your risk plan — so you never again buy a stock that looks perfect in isolation but threatens your entire portfolio. For more on keeping your whole picture in view, see our Best Portfolio Tracker for ISA and SIPP: UK Options Compared.
Your Action Plan: How to Choose and Set Up a Stockopedia Alternative This Week
Let’s turn insight into action. Here is your concrete, numbered plan to choose and set up a Stockopedia alternative this week — not by swapping one screener for another, but by building a complete research system that shows you your real risks before you trade.
Step 1: List your current brokers and the accounts you hold. Grab a piece of paper or open a note. Write down every broker you use and every account type: ISA, SIPP, General Investment Account (GIA). Note the total value in each. This step alone often reveals surprises — many UK investors discover they hold three different accounts at two brokers and have no single view of their total exposure. If you hold US stocks in a GIA, note the currency exposure too. You cannot manage what you cannot see, and your broker’s own dashboard almost certainly does not aggregate across accounts.
Step 2: Check which alternatives sync with your brokers. Not all stock screeners can import your real portfolio. Simply Wall St claims to cover over 2,000 brokers globally and can link directly to your accounts — a genuine time-saver. TIKR (at $17.95/month on its paid tier) typically requires a manual CSV import, which takes about 15 minutes but gives you full control. Koyfin also offers broker sync for many platforms. The key question: can the tool see what you actually hold, or will you need to upload a file each month? If you trade frequently, broker sync is worth paying for. If you’re a buy-and-hold investor, manual CSV is fine.
Step 3: Test the portfolio-level view, not the screener. Whichever tool you shortlist, judge it on what it tells you about your holdings as a whole — not on how many screening filters it offers. ARIA PM carries no charge, so you can run this test against your real holdings without a countdown or a card. Load a representative slice of your portfolio and look only at the portfolio-level report.
Step 4: Import your portfolio and run a portfolio-level report. Upload your CSV or connect your broker. Then run a full report that shows your sector exposure, geographic concentration, dividend income, and currency risk. This is where you see the blind spot: a tool that only screens for individual stock quality cannot show you that 60% of your capital is in UK large-caps, or that your dividend income is about to cross into a higher tax band. The portfolio-level lens is the entire point.
Step 5: Identify your top 3 risks from that report. Be honest. Common examples include: ‘60% in UK large-caps with no international diversification’, ‘£2,500 in dividends that exceed the £500 tax-free allowance, creating a £1,000-plus tax bill’, or ‘my SIPP and ISA both hold the same five stocks, so I have zero diversification across accounts’. Write these down. They are your action items. ARIA PM handles survivorship adjustment, cost modelling, and regime stress-testing automatically — so you can focus on interpreting results rather than building the simulation.
Step 6: Set a monthly review. Choose one day per month — the first Saturday, for example. On that day, screen for new ideas using your chosen tool (TIKR, Koyfin, or Stock Rover). But before you buy anything, check the portfolio impact. How would that purchase change your concentration? Would it push you further into one sector? Use a correlation calculator to see if the new stock is truly diversifying or just adding noise. This discipline — screen, then check portfolio impact — turns a good screener into a complete system. The cost of TIKR at $17.95/month is less than one bad trade from being blind to your own risk.
Why this matters — and why it’s not about abandoning Stockopedia: Stockopedia remains an excellent stock screener. This is not a ‘Stockopedia vs’ comparison that concludes you must switch. It is about adding the portfolio-level lens that Stockopedia, by design, does not offer. The truth is that even a perfect screener cannot tell you whether your ISA, SIPP, and GIA together are balanced. Tools like Koyfin — which industry research notes helped Mission Wealth close a $10 million client — exist precisely to fill that gap. They give you the complete picture.
You are not leaving Stockopedia behind. You are upgrading your system. The next trade you make will be the first one where you see not just the stock’s quality, but what it does to your total portfolio risk. That is the difference between investing with a flashlight and investing with the lights on.
Key Takeaways
- The biggest mistake a UK investor can make in 2026 is treating a stock screener like Stockopedia as a complete research system, because without portfolio-level analytics that account for your broker wrapper and total exposure, you are investing blind to your own risk.
- A true Stockopedia alternative must give you both a microscope for screening stocks and a telescope for portfolio-level analytics, allowing you to spot a 40% sector overlap or a dividend yield that misses your target.
- Stockopedia’s proprietary StockRanks are excellent for building a watchlist, but the platform stops at the stock level and cannot answer critical questions about concentration risk inside your ISA or SIPP.
- Without portfolio-level tools, you cannot track your total effective dividend yield across all accounts relative to the new £500 dividend allowance, leaving a critical tax-planning blind spot open.
- At $600 per year for the U.S. & Canada plan, Stockopedia represents a serious financial commitment for a tool that cannot show you how your five-star picks interact across your entire portfolio.
| Feature | Stock Screener (e.g., basic filters) | Full-System Alternative (e.g., Stockopedia-style) |
|---|---|---|
| Purpose | Find individual stocks by criteria | Manage total portfolio risk and exposure |
| Portfolio analytics | None — you must calculate manually | Built-in, shows concentration and correlation |
| Broker wrapper awareness | Ignores ISA/SIPP tax status | Accounts for tax treatment and contribution limits |
| Risk visibility | Blind to overlapping holdings | Highlights sector, geography, and factor overlaps |
| Typical output | A list of "buy" candidates | A complete risk budget with trade-offs |
Comparison Table 2: Key Metrics a Stockopedia Alternative Must Provide vs. Common Screener Metrics
| Metric | What a Screener Gives You | What a Full-System Alternative Gives You | Why It Matters for UK Investors in 2026 |
|---|---|---|---|
| Portfolio diversification | Stock count only | Sector, country, and factor correlation | Avoids hidden concentration (e.g., too many UK miners) |
| Risk-adjusted return | Raw return % | Sharpe ratio, downside deviation | Reveals if high returns come from excessive risk |
| Tax-adjusted performance | None | Net-of-tax return for ISA vs. SIPP | Stops you from mistaking gross for net gains |
| Broker wrapper integration | Not tracked | Automatically applies dividend tax and CGT rules | Prevents costly surprises at year-end |
| Total portfolio exposure | Sum of individual positions | Weighted exposure by factor and region | Stops you from being blind to your own risk |
Sources
- FCA publishes landmark review into impact of AI on retail financial services | FCA — FCA review of AI impact on retail financial services, shaping future investor tools.
- fca.org.uk — FCA policy statement on consumer investments, including regulation changes for 2026.
- fca.org.uk — FCA consumer investments report detailing risks and protections for UK retail investors.
- DP25/3: Expanding consumer access to investments | FCA — FCA discussion paper on expanding consumer access to investments for ordinary people.
- Pricing Plans — Stockopedia’s official pricing plans, direct from the platform for cost comparison.
- TIKR Pricing: Affordable Investment Analysis Plans - TIKR | TIKR.com — TIKR pricing page showing affordable investment analysis plans for UK users.