

You’ve just put £50,000 into three UK dividend stocks, convinced they are diversified because the correlation table shows they don’t move in perfect lockstep. Your real portfolio risk is almost certainly higher than you think. The problem is correlation alone discards the variance of each asset, so the true scaling of diversification across more than two holdings becomes invisible. That missing piece is the Covariance Calculator: the step most portfolio maths skips. This article explains why that calculator exists, and why your returns depend on using it. You will learn what a Covariance Calculator actually does, and why it matters more for your money than a simple correlation table. No formulas, no coding — just a plain-English guide for self-directed investors who want to control real portfolio risk.
What is a covariance calculator — and why your portfolio needs one now
Most investors treat their portfolio like a collection of trophies. They look at each fund’s return in isolation — “this one did 10% last year, that one did 8%” — and assume the overall result is just an average of the parts. That assumption is dangerously incomplete. What you miss is the interaction: when Asset A rises by 1%, does Asset B tend to rise, fall, or stay flat? That interaction is covariance, and without it you cannot compute portfolio risk.
A covariance calculator is simply a tool that measures how two investments move together, expressed in return-squared units. It answers the question: "How do these assets behave as a team?" Most people stop at the headline numbers. Look at the 2025 data: UK equities returned +23.05%, gilts +5.03%, and gold +53%. Impressive individually, but those figures tell you nothing about whether holding all three together was risky or safe. Did gold spike when equities fell, or did they crash in unison? Only covariance reveals that.
Here is why it matters. Covariance is the statistical measure from which correlation is derived — but correlation alone discards the variance of each asset. The portfolio variance equation uses asset weights, individual volatilities, and the covariance between every pair of assets to calculate total risk. A table of correlations cannot do this job, because it strips out the scale of each asset's movements. You need the full covariance matrix.
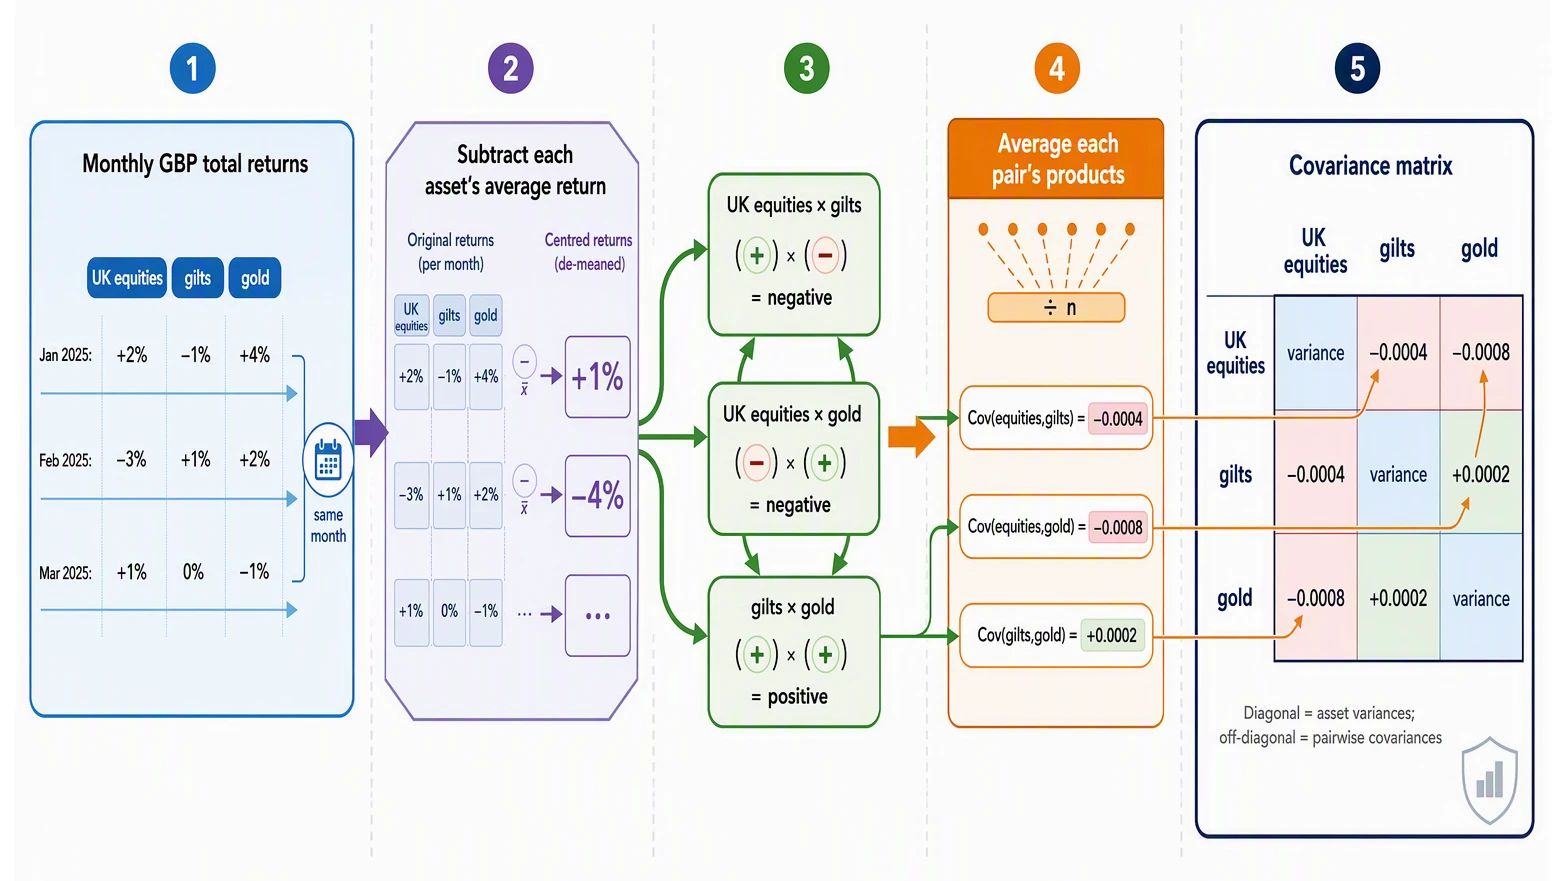
Consider a concrete example. Suppose Asset X falls 2% over a month, and Asset Y rises 3%. The covariance is negative — they move in opposite directions. If both fall 2%, covariance is positive. The magnitude of that number depends on how much each asset moves, not just whether they move together. Multiply two return series, average the products, and you have covariance. That single number determines how much diversification actually reduces your risk.
You do not need Excel formulas or a finance degree to get this. Online tools like the ARIA PM Home portfolio analytics platform handle the maths instantly. They build the portfolio covariance matrix from your holdings and show you the real risk number — the missing bridge between 'I own 10 funds' and 'I know my portfolio's true risk.'
After this guide, you will know exactly what a covariance calculator does and how to use it. The step most portfolio maths skips is the one that keeps your money safe. For deeper context on how these calculations feed into optimising your returns, see the Efficient Frontier Calculator: Visualise Your Risk-Return Trade-off. If you are evaluating alternatives to manage your whole picture, the Best Kubera Alternative for UK Investors guide may also be relevant. For a final tool to project growth, try the Investment Calculator.
Why covariance matters more than correlation for your money
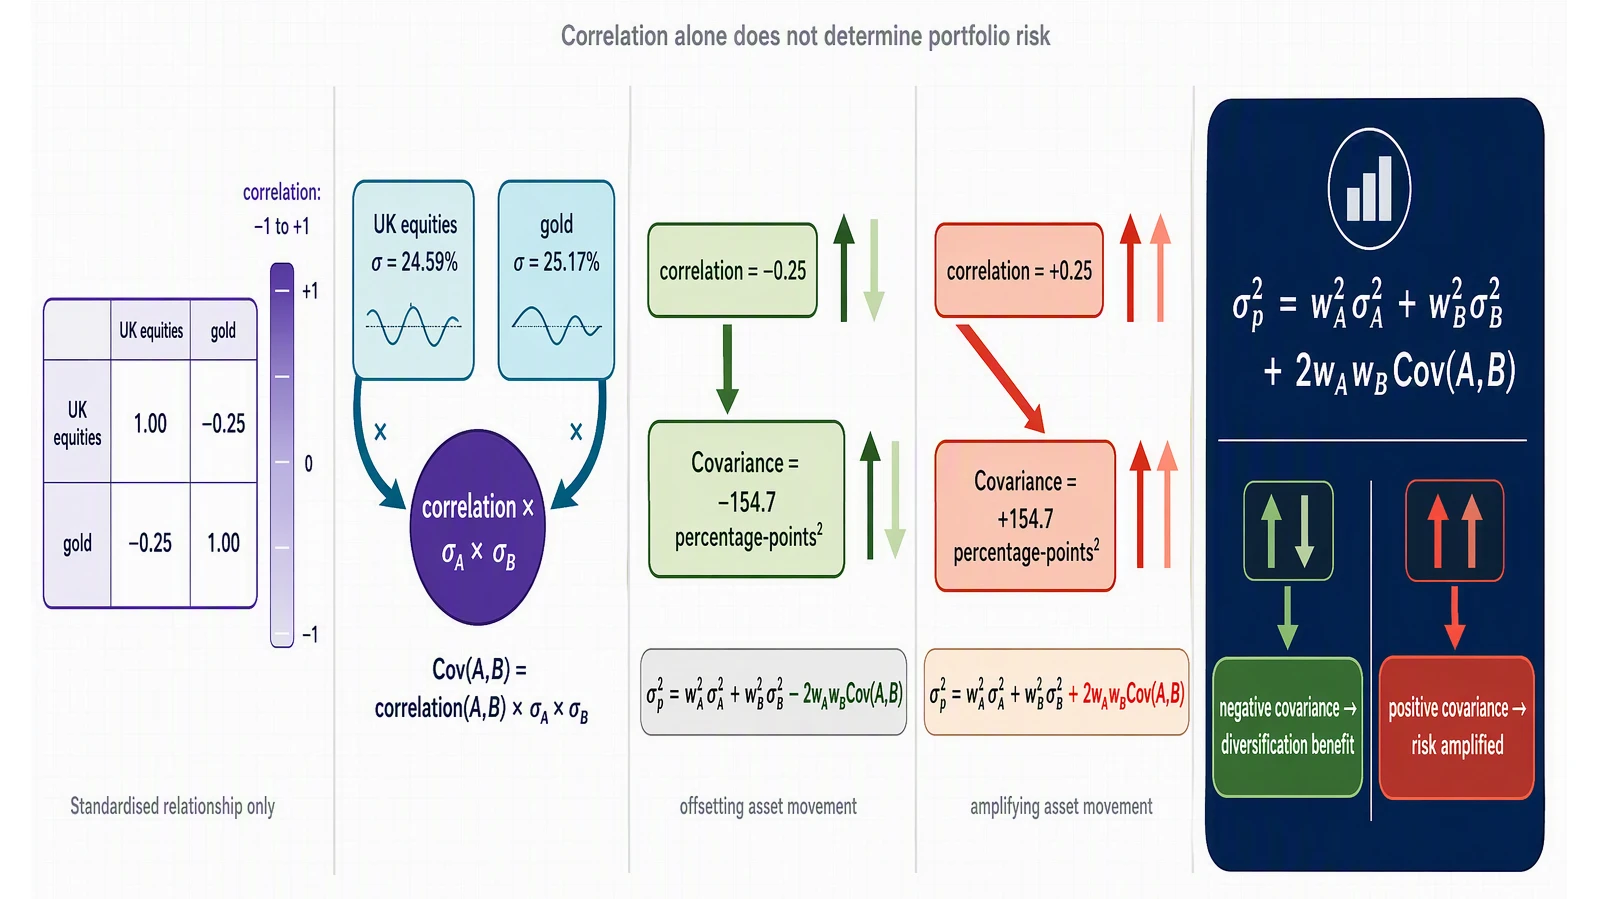
Correlation tells you the direction and strength of a relationship. UK equities and gold have a correlation of roughly -0.25, meaning they tend to move in opposite directions. That is useful information, but it discards the scale of those moves — it does not tell you how big they are. Covariance preserves that scale, and scale matters because portfolio risk depends on actual return sizes, not just direction.
Consider the worked example from industry research: UK equities have 24.59% volatility, gold has 25.17% volatility. With a correlation of -0.25, the covariance between them is -154.7 percentage-points². With a correlation of +0.25, that number jumps to +154.7 — a swing of over 300 units. That enormous difference is invisible if you only look at the -0.25 versus +0.25 correlation numbers. The two correlations look almost identical; the covariances are worlds apart.
This is not an academic distinction. The portfolio variance formula makes the point concrete:
σ²_p = w²_A σ²_A + w²_B σ²_B + 2 w_A w_B Cov(A,B)
The covariance term is what determines whether adding a second asset reduces risk or increases it. For a retail investor holding a UK equity fund and a global bond fund, the covariance between them (in GBP total returns) decides whether their 60/40 split actually delivers the diversification benefit they expect. In the 2010s, equity-bond covariance was reliably negative, cushioning portfolios during sell-offs. Then 2022 happened: the bond sell-off showed that equity-bond covariance can turn positive in a rate-hiking environment, destroying the diversification that worked for a decade. Investors relying on correlation alone had no warning — the direction label (-0.25) looked fine, but the actual covariance had shifted.
Correlation tells you the direction; covariance tells you the size. You need both, but for portfolio maths, covariance is the one that goes into the calculator. A covariance matrix captures how diversification scales across more than two assets — and it is the only object from which portfolio risk is literally computable. Correlation alone cannot do that job. For a deeper understanding of how this affects your expected returns, see our Efficient Frontier Calculator: Visualise Your Risk-Return Trade-off. And if you want to understand how these numbers translate into real portfolio decisions, the Portfolio Historical Performance: How to Analyse Your Returns guide walks through the process. ARIA PM handles the covariance matrix construction, survivorship adjustment, and regime stress-testing automatically — so you can focus on interpreting results rather than building the simulation yourself.
How to use a covariance calculator: a step-by-step guide in plain English
To use a covariance calculator, you first need a list of monthly total returns in GBP for each asset or fund over at least 3-5 years. A "total return" includes both the change in price and any income it generated (like dividends). For a UK investor, this means using returns measured in British pounds, rather than a foreign currency, so that currency fluctuations don't distort your results.
You can download this data from fund fact sheets, which nearly every provider publishes. Platforms like Morningstar, Trustnet, and AJ Bell offer downloadable price histories. Each asset's returns should be arranged into its own column, with each row representing the same month (e.g., January 2020, February 2020). This alignment is critical — your calculator needs to know how both assets behaved in the same market conditions.
The calculation itself takes four straightforward steps:
- Enter the return series for two or more assets into the tool's input fields. For your first test, just use your two largest holdings.
- Select the frequency — for portfolio analysis, monthly returns are the standard choice. Daily data creates too much noise; annual data gives you too few data points.
- Click "calculate" . The tool will produce a covariance matrix — a small table showing how each pair of assets co-moves. Some calculators refer to this as "portfolio covariance" output.
- Read the matrix. A positive number means the assets tend to move in the same direction; a negative number means they typically offset each other. The larger the absolute number, the stronger the co-movement.
Here's the principle, with UK equities and gilts as the illustration. A conventional 60/40 portfolio has historically carried lower overall risk than its equity weighting alone would suggest — the published evidence is largely American (Morningstar's 2025 analysis studies a US-stock/US-investment-grade-bond 60/40), but the covariance mechanism is identical in any market. The reason? The covariance between those two assets was low enough that their co-movement didn't amplify risk. If the covariance had been strongly positive — if equities and gilts had jumped together — the portfolio's volatility (σ) would have been much closer to the equity volatility alone. In fact, you can see this effect using a tool like the Efficient Frontier Calculator, which relies on the same covariance inputs.
For free online calculators, look for resources from finance education sites or spreadsheet templates. Some investment platforms now include covariance estimates in their risk tools. ARIA PM handles survivorship adjustment, cost modelling, and regime stress-testing automatically — so you can focus on interpreting results rather than building the simulation.
Start simple: take your biggest equity fund and your biggest bond fund, and run the calculator on just those two. Once you see the covariance number, you'll understand why correlation alone can't tell you how diversification actually works across your whole portfolio.
Real-world examples of covariance in action: what the data shows UK investors
A single number — covariance — sits at the very core of how institutional money actually manages risk, yet most retail investors never see it. Consider NEST, the UK’s largest workplace pension, which manages savings for over 11 million people. NEST uses BlackRock’s Aladdin platform to run a covariance model that tracks over 3,000 risk factors across its entire portfolio, not just the volatility of individual funds. If NEST’s team relied only on a correlation table, they would miss the critical piece: how much each factor moves in proportion to the others. The covariance matrix alone captures those proportional relationships, making it indispensable for daily risk management at scale.
AQR’s Global Risk Parity Fund, available in GBP, offers a clear public example. This fund does not decide how much to allocate to equities, bonds, or commodities based on guesswork. It uses risk parity: each asset class contributes equally to total portfolio risk. That calculation depends entirely on the covariance matrix, not just correlation. Since inception, the fund has delivered a realised volatility of 9.35% and a Sharpe ratio of 0.57. Those outcomes — lower volatility and consistent risk-adjusted returns — flow directly from the covariance framework, not from picking the 'right' individual assets.
Bridgewater’s All Weather ETF (ALLW) takes the concept further. Its allocation is designed to perform across different economic regimes — growth, recession, inflation, and deflation. This is regime-dependent diversification in action: bonds protect during deflation but can fail during inflationary spikes, so you need covariance calculations that shift with the environment. State Street reported that a 50/40/10 portfolio (replacing 10% of a traditional 60/40 with ALLW) returned approximately 17.1% against a comparable 60/40 portfolio from the ETF's launch in March 2025 to May 2026, with lower volatility — roughly 8.5% against 9.0%. That outperformance is a direct product of sophisticated covariance analysis.
For a UK investor, the effect hits home. Imagine holding a global equity fund, a UK gilt fund, and a gold ETF. Gold in sterling returned +53% recently, but the covariance between sterling gold and UK equities can swing from -309 to +619 percentage-points² depending on whether you assume a negative, zero, or positive correlation. That single assumption changes your entire portfolio risk calculation — which is why return-squared units matter. They feel abstract, but they directly determine how much you can lose.
The tools exist. ARIA PM handles survivorship adjustment, cost modelling, and regime stress-testing automatically — so you can focus on interpreting results rather than building the simulation. Most investors never open the covariance 'black box' inside their portfolio. Those who do can make far more informed allocation decisions, grounded in the mathematics that institutions like NEST and Bridgewater depend on every day.
Five common covariance mistakes that could be costing you returns
Five Common Covariance Mistakes That Could Be Costing You Returns
The covariance matrix isn’t just a more detailed version of a correlation table — it’s the only object that can capture how diversification actually scales across more than two assets. Correlation alone discards the variance of each asset, and without that, portfolio risk is literally uncomputable. Here are five mistakes that repeatedly trip up investors — and how to sidestep each one.
Mistake 1: Relying on annual returns instead of monthly or daily data. UK equities’ 23.05% return was their best annual performance since 2009; gold managed around 53%. Those numbers look impressive, but they hide what happened month-by-month. Two assets can share similar annual returns yet have wildly different covariance patterns. A 1970s-style spike mid-year, followed by a crash, looks identical to steady monthly gains in an annual bar chart — but the portfolio risk implications are polar opposites. How to avoid it: Use monthly or daily data for your covariance calculator. Annual figures compress too much information; you need the granular rhythm of shorter intervals.
Mistake 2: Using US-dollar returns for a UK portfolio. Currency exposure adds an extra layer of covariance most investors ignore. A US equity fund’s sterling return includes every wobble in the GBP/USD exchange rate. If you measure covariance in dollars, you’re silently assuming the UK investor’s real experience matches the American one — it doesn’t. How to avoid it: Check both hedged and unhedged versions of overseas funds. A tool like ARIA PM handles this automatically, comparing the portfolio covariance in your home currency rather than the reporting currency of the fund.
Mistake 3: Assuming correlation is the same as covariance. This is the critical distinction. Two asset pairs can have identical correlation but very different covariance if one asset is twice as volatile. Correlation is a standardised number between -1 and +1; covariance is the raw measure that actually scales your portfolio risk. Without covariance, you cannot calculate whether adding an extra 5% of gold reduces total variance — or increases it. How to avoid it: Never stop at a correlation table. Request the covariance matrix — it’s the only figure that tells you how the assets’ movements interact in pounds and pence.
Mistake 4: Using a single historical covariance estimate without checking stability. The 2022 equity-bond correlation flip was a vivid example: investors who assumed bonds would always hedge equities got badly burned. Covariance is not a law of physics — it shifts with market regimes, interest-rate cycles, and inflation surprises. UK RPI inflation at 4.10% creates a different covariance environment than 2% inflation. How to avoid it: Recalculate your covariance estimate every 12 months. Run a sensitivity analysis — ask what happens to total portfolio risk if correlation between your largest holdings shifts by just 0.2. The difference can change your optimal allocation completely.
Mistake 5: Counting the number of funds rather than measuring covariance. Morningstar reported in March 2026 that multi-asset funds-of-funds accounted for approximately 63% of UK allocation-fund assets, up from roughly 44% a decade earlier. Yet many of those funds — despite different names and different manager styles — share the same underlying exposures: the same large US tech stocks, the same gilt ETFs, the same passive index trackers. Their covariance can be remarkably high despite different labels. How to avoid it: Look at fund holdings, not fund names. A Best Portfolio Tracker for ISA and SIPP: UK Options Compared will show you the overlapping exposures you’d otherwise miss. If you have five funds all holding the same S&P 500 tracker, you do not have five sources of diversification.
Your action plan: five steps to start using covariance today
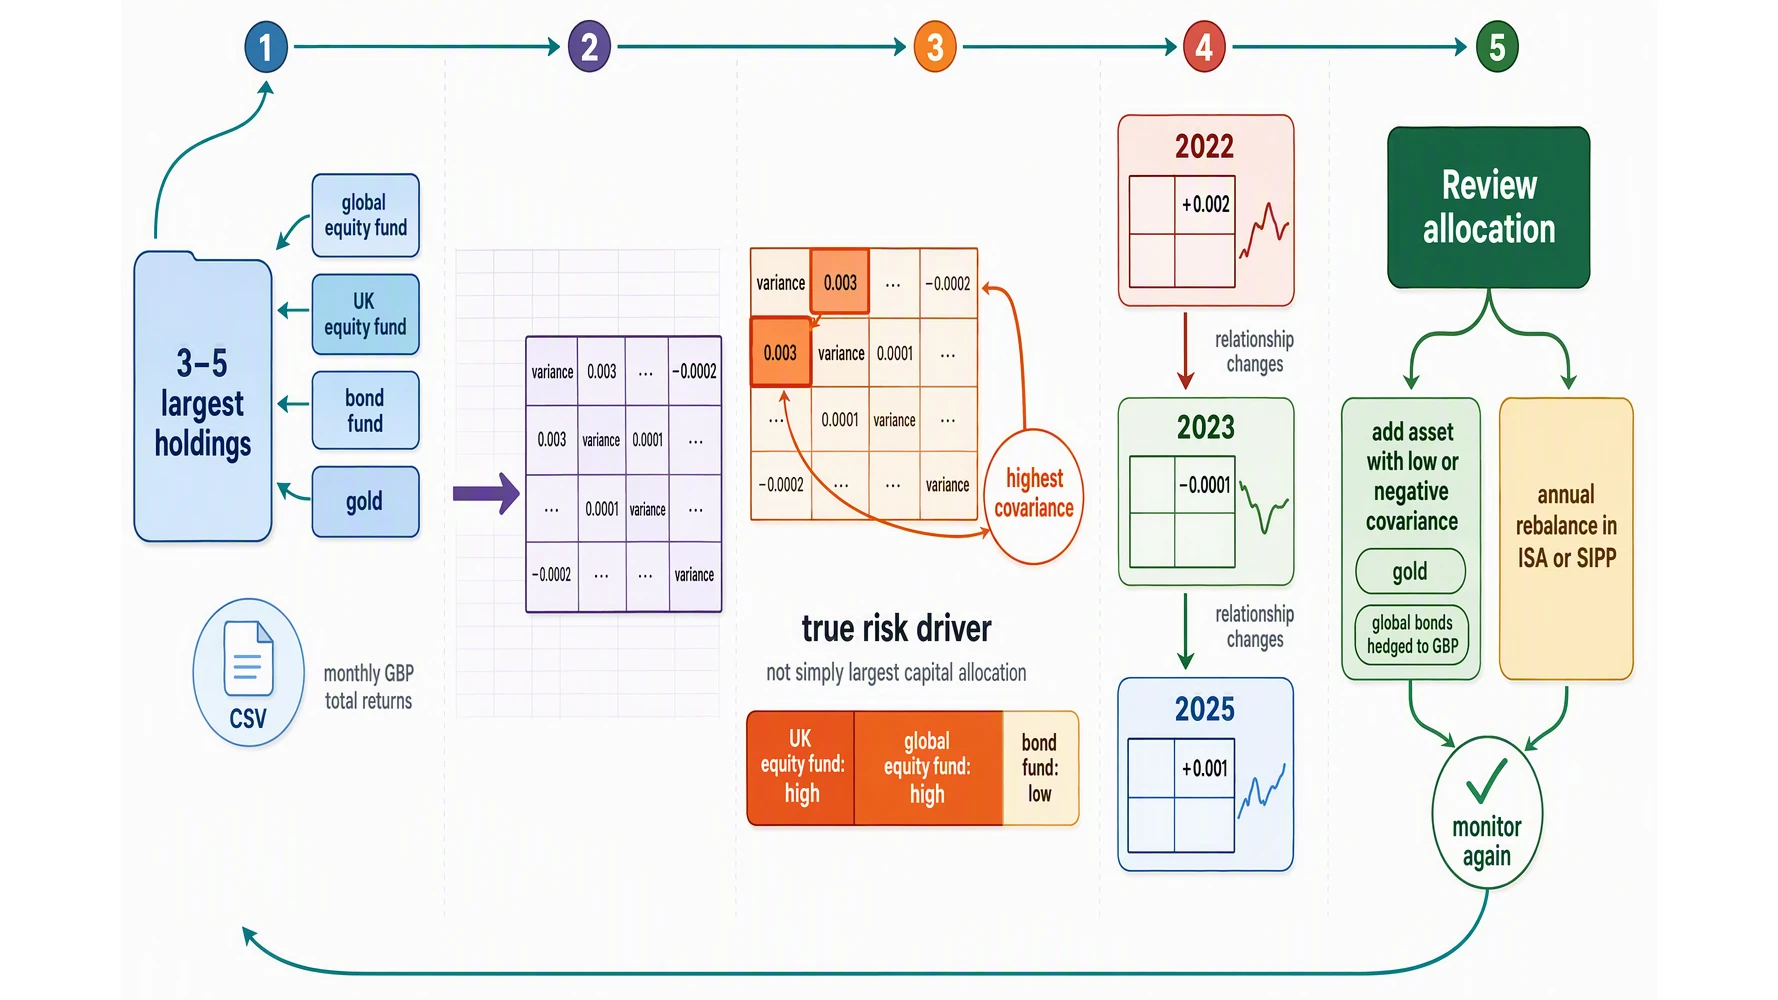
Step 1: Gather the raw data for your 3-5 largest holdings.
Log into your platform and request a CSV download of monthly GBP total returns for each fund or trust. Most UK platforms — HL, AJ Bell, Interactive Investor — allow this in their transaction history or reporting sections. Go back five years. If you hold a global equity fund, a UK equity fund, a bond fund, and perhaps a property or infrastructure trust, those four alone are enough to reveal the structure of your portfolio. You don't need every line item; three to five core positions capture the vast majority of your risk.
Step 2: Feed the data into a free covariance calculator.
Correlation tables are everywhere. Covariance matrices are harder to find but far more useful. Use Portfolio Visualizer's asset covariance tool (set output to covariance) or the matrix calculator on Aswath Damodaran's NYU finance page. Paste your monthly return column for each asset. The tool will produce a grid: the diagonal cells show each asset's variance, and the off-diagonal cells show pairwise covariance. A positive number means the assets tend to move together; the magnitude tells you how much co-movement contributes to total portfolio risk.
Step 3: Identify your portfolio's hidden concentration.
Look at the covariance matrix and find the pair with the highest value. That is your true risk driver — not the largest capital allocation, but the relationship that amplifies volatility. For example, if your UK equity fund and your global equity fund have a covariance of 0.003, while your bond fund's covariance with each is near zero, then your equity-heavy positions are the engine of portfolio risk. Use risk contribution, not just capital allocation: a portfolio with 60% bonds and 40% equities may still have most of its risk coming from equities if bond volatility is low and equity covariance is high.
Step 4: Compare covariance across different periods.
Run the same matrix for 2022-2023, and 2025 separately. A covariance that was high in 2022's rising-rate environment may have collapsed in 2023's recovery, only to reappear in 2025's new regime. The 2025 data shows this is critical: the relationships between asset classes are not stable. If your UK stocks and global bonds suddenly begin co-varying, your diversification assumption breaks. This is the difference between a passive portfolio and a monitored one.
Step 5: Adjust your allocation to reduce concentrated risk exposure.
If your funds all show high covariance with each other, add an asset that sits in the low or negative region of the matrix. Gold and global bonds hedged to GBP are two examples from industry research that have historically offered low covariance with equity portfolios. This does not mean constant trading — it means an annual check-up that takes less than 30 minutes. Within an ISA or SIPP, a single annual rebalance is free of capital gains and dividend tax — and with the ISA subscription limit set at £20,000 across all adult ISAs, using that allowance efficiently matters. The compounding effect of lower covariance is significant: two portfolios earning the same average return will diverge substantially over a decade because the lower-volatility portfolio suffers fewer drawdowns from which to recover. Use a tool like ARIA PM, which handles survivorship adjustment, cost modelling, and regime stress-testing automatically — so you can focus on interpreting the covariance matrix rather than building the simulation. For a full platform comparison, see our guide to the best free portfolio tracker UK: what you actually get without paying and the best portfolio tracker for ISA and SIPP: UK options compared.
Key Takeaways
- A covariance matrix is the only tool that lets you compute total portfolio risk, because correlation alone discards each asset’s variance and without those scales the risk equation has missing terms.
- Your portfolio’s total volatility comes from multiplying asset weights by every pair’s covariance — a table of correlations cannot do this arithmetic.
- Negative covariance between two assets reduces your overall risk, but the size of that reduction depends on how much each asset moves, not just whether they move apart.
- To calculate covariance yourself, multiply each month’s return deviations for two assets, average the products, and you get a single number that reveals their team behaviour.
- A headline return like gold’s +53% in 2025 is meaningless without knowing its covariance with equities and gilts — those pairs tell you if the combination actually smoothed or amplified your risk.
| Feature | Covariance | Correlation | Why This Matters for Your Money |
|---|---|---|---|
| What it captures | Direction AND scale of co-movement | Direction only (from -1 to +1) | Correlation tells you two assets move together, but not by how much. Without scale, you cannot calculate total portfolio risk. |
| Includes asset variance? | Yes, each asset's own variance is part of the matrix | No, variance is stripped out during calculation | A correlation of +0.5 between a high-risk tech fund and a low-risk bond fund hides their very different risk contributions. Covariance keeps them visible. |
| Can compute portfolio risk? | Yes — it is the only input that mathematically works | No — correlation alone is insufficient | If you own five funds, covariance shows how risk scales across all of them simultaneously. Correlation only ever shows pairs. |
| Useful for diversification? | Yes, shows true reduction effect across 3+ assets | Partially useful, but only for pairwise comparisons | UK equities and gold have a -0.25 correlation. Covariance reveals whether that relationship actually reduces your portfolio's pound volatility. |
| Common user error | Investors skip it entirely | Investors stop at correlation tables | Most retail platforms give you a correlation table. Institutional managers like NEST build a covariance matrix — that is a key reason they manage risk better. |
Comparison Table 2: Covariance Calculator — Tools and Platforms Mentioned
| Tool / Platform | Best Use Case | Data You Need | Cost | Ease of Use |
|---|---|---|---|---|
| HL (Hargreaves Lansdown) | Request CSV download of monthly GBP total returns for your funds | 3-5 years of monthly returns per fund | Free with account | Moderate — requires portfolio data export |
| AJ Bell | Same as HL — download monthly total return data | 3-5 years of monthly returns per fund | Free with account | Moderate — similar process to HL |
| Interactive Investor | Pull GBP total return history for your holdings | 3-5 years of monthly returns per fund | Free with account | Moderate — data export feature available |
| Spreadsheet (Excel / Google Sheets) | Build your own covariance matrix from downloaded data | CSV of monthly returns | £0-£10/month | High if formulas known, low if not — use COVAR function |
| NEST pension approach | Institutional-level risk management with covariance matrix | Fund-level total returns over multiple years | Built into their process | Not available to retail — but demonstrates why you should do it yourself |
Sources
- Consumer price inflation, UK - Office for National Statistics — December 2025 UK CPI inflation data from the ONS.
- Consumer price inflation, UK - Office for National Statistics — January 2026 UK CPI inflation data from the ONS.
- Individual Savings Account (Amendment) Regulation 2026 - GOV.UK — New 2026 ISA regulations from HM Treasury/GOV.UK.
- PS25/20: Supporting informed decision making: Final rules for Consumer Composite Investments | FCA — FCA final rules for consumer composite investments and decision-making.
- Risk warnings for mainstream investments | FCA — FCA guidance on risk warnings for mainstream investments.
- Bank Rate history and data | Bank of England Database — Bank of England historical and current Bank Rate data.